
Usage-Based Pricing: The Per-Truck + 2.4% Hybrid That Beat Pure Consumption
Usage-based pricing is an architectural choice, not a pricing tactic. It fits some archetypes and actively harms others. This guide is the diagnostic that tells you whether UBP fits your business, how to pick the meter that tracks customer-realized value, how to design a hybrid that protects predictability for both sides, and how to roll it out with rollback gates named in advance.

The Operator's Guide to Usage-Based Pricing
Your finance team wants usage-based pricing because a competitor posted a good quarter. Your CS team is nervous. Your best customer just asked for a flat fee.
You are not debating pricing. You are debating architecture. The meter you pick, the floor you keep, and the gates you name decide whether the move adds gross margin or costs you a third of your renewal book.
Pricing is a signal before it is a number, and the wrong meter reads as opportunism no matter what the math says on your side of the table. Usage-based pricing creates predictable revenue problems as often as it solves them. That is not an argument against it. It is the reason the decision deserves a process instead of a reflex.
TL;DR
- Usage-based pricing fits some commercial archetypes and harms others. Audit the archetype before you touch the meter
- A billing metric must be observable by the customer, rise with customer success, and be forecastable before signing
- Pure consumption is rare for good reason. A committed minimum plus a variable meter protects your forecast and the buyer's budget
- The usage dashboard ships before the first invoice. Telemetry the customer can audit is the precondition
- Rollout without pre-signed rollback gates is how operators lose their renewal book
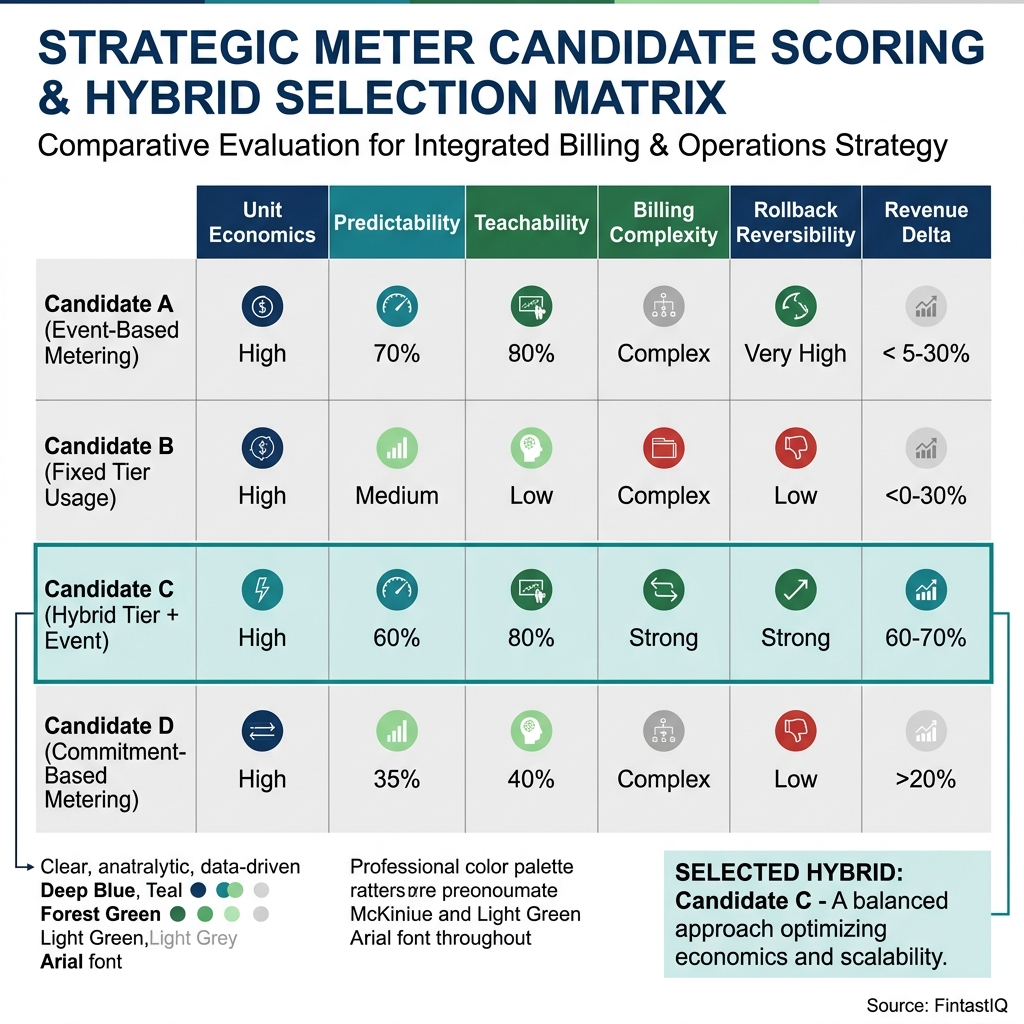 Exhibit: Meter scorecard (4×6)
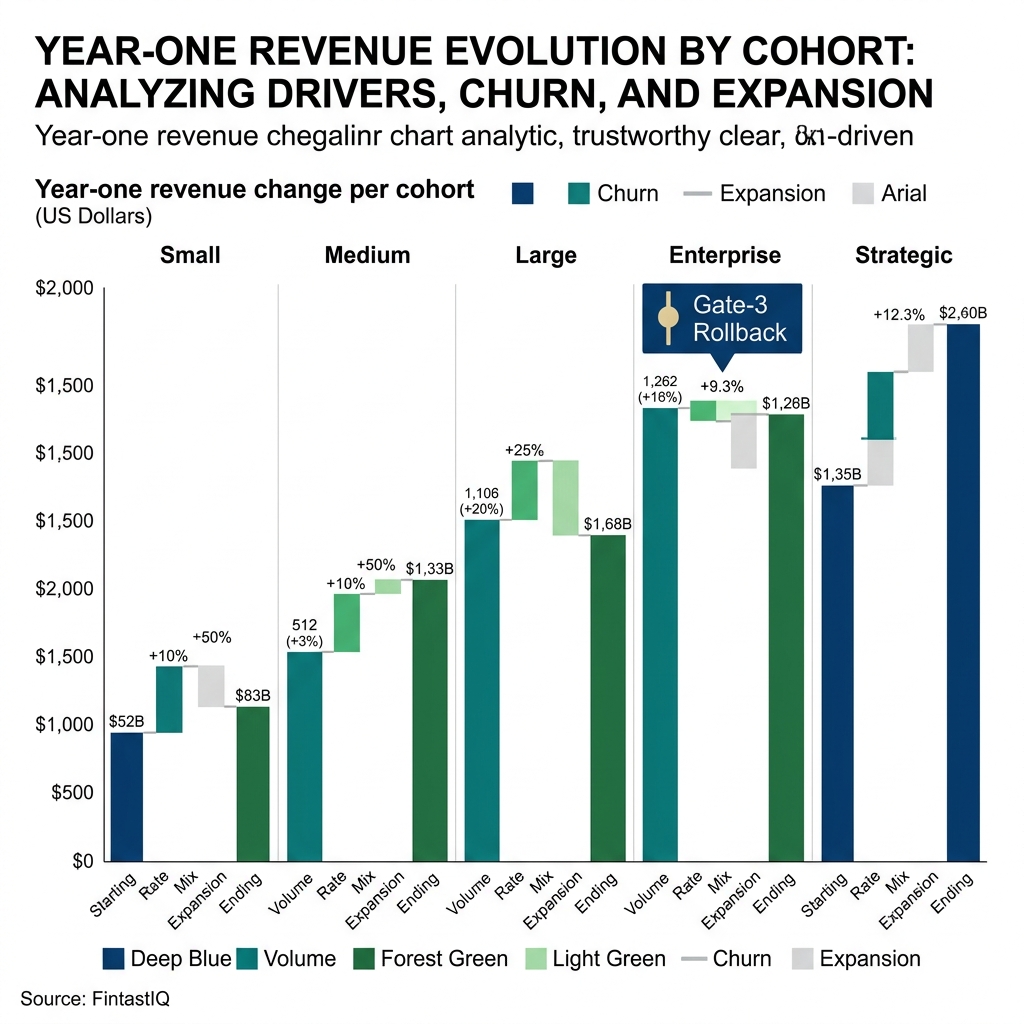 Exhibit: Fleet waterfall by cohort
The core problem
Most operators treat usage-based pricing as a pricing tactic. It is an architectural commitment that rewires how revenue flows, how customers experience the invoice, how CS runs expansion conversations, and how finance forecasts. Treating it as a spreadsheet exercise is how operators end up rolling back six months in.
Meet Stellare Telemetry. 110 people, $52M revenue, split 38 percent hardware plus software and 62 percent parts-marketplace take rate. Stellare sells on-board telemetry units and fleet management software to mid-size trucking operations and runs an aftermarket parts marketplace attached to fleet usage data. 820 fleets, from 5 to 240 trucks each. The CFO is Anya. Stellare, like every company in this guide, is an illustrative composite; the numbers show the shape of what happens, not any one client's books.
The pressure came from three directions at once. The board wanted a growth story tied to fleet utilization. A competitor had launched a per-mile meter with a loud PR push. And Anya's own analysis showed the largest fleets generating six times the marketplace volume of the smallest while paying only 1.6 times the software license. The executive team wanted to copy the competitor's per-mile meter. Anya pushed back: the competitor was software-only, and Stellare's meter needed to reflect the value the customer received, not the activity the software happened to track.
This is the pattern. The competitor moves, the board reacts, the meter gets picked on instinct, and six months later the renewal book is bleeding. The best operators compete on discipline, not instinct. Pricing maturity is measured by what you stop doing, and copying a competitor's meter is the first habit to quit. The rest of this guide is the discipline, in the order Stellare ran it.
Seat-based or usage-based: the archetype test
Before any meter design, three questions, answered in writing, with evidence.
Does customer value scale with a countable unit the customer already understands? For Stellare the answer split. On the parts marketplace, yes: every order is a countable event the fleet manager sees. On the telemetry platform, fleet managers did not think in miles. They thought in trucks, the asset they budgeted, insured, and deployed.
Does cost to serve scale with the same unit? For the marketplace, yes. For the platform, no. Serving a 200-truck fleet was not 40 times more expensive than serving a 5-truck fleet. Cost scaled with truck count and support tier, not miles.
Do buyers prefer to pay as they consume, or do they need predictable budgets? Six customer interviews across the fleet size range: small fleets wanted predictability, large fleets wanted the upside of scale-based pricing, and neither wanted pure consumption, because diesel volatility already made their costs unpredictable.
A rule of thumb from a16z sharpens the first question: usage-based pricing works best when the end user of the product is software, and subscription works best when the end user is a human. A pipeline that processes records all night consumes in proportion to the work it does; a person opening a dashboard twice a day does not. If your product is used by people at a desk, the seat is probably already a decent proxy for value.
The test cuts both ways. Pure consumption without a floor turns predictable ARR into revenue an acquirer discounts; staying seat-based when your top quartile uses the product at five times the median means your best accounts subsidize the median customer. The test tells you which mistake you are closer to.
For Stellare it ruled out pure per-mile and pointed at a hybrid: a per-truck fixed component on the platform and a take rate on the marketplace. Ramanujam and Tacke in Monetizing Innovation argue for willingness-to-pay research before product design; the same logic applies in reverse to pricing architecture. Research the buyer's budgeting unit before you design the meter. The SaaS pricing strategy guide covers where the meter decision sits among the other architecture choices.
Value metric vs usage metric
The value metric is what customers buy your product to achieve. The usage metric is the proxy you bill against. A project management tool creates value through faster delivery; milestones tracked is a plausible usage metric, and logins is not. The metric most teams choose is the one easiest to count. API calls. Events processed. Records created. Easy to instrument, and frequently wrong.
Larkspur DevTools, $22M ARR, announced API-call pricing at its user conference. Within eight months, customers who optimized their call patterns were penalized for doing what the product encouraged, procurement could not forecast annual spend, and two enterprise accounts churned citing budget unpredictability by name. Larkspur spent six months rebuilding a hybrid. API calls were never a value metric. They were a technical event, announced from a stage before anyone tested the hypothesis.
Three tests a billing metric must pass
Three conditions have to hold. Most implementations violate at least one.
The customer can observe the metric without engineering support. If your customer needs your support team to explain the invoice, the metric is wrong. Send your five largest accounts a usage report and ask them to verify it against their own records without help. The share who can is your transparency score.
Usage scales with customer success, not customer inefficiency. A storage product billing per gigabyte rewards hoarding. A messaging platform billing per message rewards verbosity. If usage can rise for reasons unrelated to success, or inversely to it, the metric is misaligned.
The customer can predict the bill before signing an annual contract. Procurement cannot approve an open-ended commitment, and without a credible forecast reps quote minimums that leave expansion uncaptured. Show a prospect what accounts of their size and use case spend over 12 months, as a range.
Quillstone, a $14M ARR document processing platform, billed per page processed and failed all three tests. Customers did not track pages, more pages often meant re-running failed jobs, and page counts swung with document complexity. After two years Quillstone switched to documents completed without re-submission: observable, tied to success, forecastable from volume. NRR moved from 98 to 114 percent within four quarters.
NRR quintiles for candidate metrics
Segment customers into NRR quintiles and, for each, pull the 12-month average of every measurable usage metric. The metric with the steepest gradient from lowest quintile to highest is the one most correlated with value, and your leading candidate. If no candidate separates the top quintile from the bottom, a meter will redistribute revenue without creating expansion, and tiered seat pricing with an overage provision gets you 80 percent of the alignment at 20 percent of the complexity. The analysis fits in a spreadsheet in half a day if the data exists. If it does not, that is a telemetry problem before it is a pricing problem.
Loomcraft, a $16M ARR collaboration platform, chose active users per month because the billing system already tracked it. The quintile analysis, run six months after launch rather than before, inverted the picture: its highest-NRR accounts were senior, efficient teams with low user counts, and its lowest-NRR accounts were large, less efficient teams that churned on weak ROI. Loomcraft switched to outcomes completed within ten months. Run before launch, the analysis would have flagged the inversion in week two.
Scoring the shortlist
Stellare scored four candidates against six criteria: comprehension, cost-to-serve alignment, predictability, fleet-size fairness, gameability, and invoice legibility. Per-mile at $0.004 scored well on one cost driver and poorly on comprehension. Per-truck at $18 per month scored strongly on both comprehension and predictability. Per-maintenance-event at $3.50 sounded clever and was terrible: customers would avoid logging maintenance to suppress the invoice. Per-parts-order at 2.4 percent was clean; fleet managers already understood take rates, and it scaled with cost to serve.
Stellare selected the hybrid: per-truck on the platform, 2.4 percent on the marketplace. Hermann Simon in Confessions of the Pricing Man calls this the meter of least regret: the one the customer understands, the accountant can reconcile, and CS can explain without a deck. Confusion is the enemy of willingness to pay. The usage-based meter designer compresses the scoring from quarters to weeks.
Three decision gates before you commit
Once the metric is chosen, three gates stand between the analysis and the announcement.
Gate one: a clear value metric exists and has passed the three tests. No hybrid structure rescues a bad meter.
Gate two: three scenarios are modeled against the existing base. Run every current customer through pure consumption, a hybrid with a committed minimum plus usage upside, and a tiered model that caps usage within bands, and calculate projected ARR, churn risk, and expansion upside for each. Then ask the blunt question of your top 30 accounts: would they have paid more or less last year? If the median is lower, the design is a price cut for your best accounts dressed up as model innovation.
Gate three: the design fits the exit horizon. An acquirer's CFO models forward revenue. Committed ARR they can model gets a multiple; a consumption base they cannot forecast gets a discount applied to the whole business, not the variable slice. On a $50M ARR exit, one turn of multiple is $50M of enterprise value, and the gap between a hybrid and a pure-consumption base is measured in turns. Inside 18 months of a sale or a raise, a hybrid is usually the right answer. Larger changes belong in years one and two of a hold.
Brackenridge, a developer tools company at $14M ARR, moved to pure consumption nine months before an exit process. The first renewal cohort showed a 22 percent revenue drop as mid-range customers who had paid for unused capacity simply reduced consumption to match, and ARR fell to $11M. A committed minimum at 70 percent of each customer's prior ARR, with upside above the floor, stabilized ARR at $12.5M. The exit closed below the pre-transition projection because the diligence team priced the volatility they had just watched happen.
One check before the gates. If more than 30 percent of your top 50 customers use less than half of what they bought, you do not have a usage-based pricing opportunity. You have an adoption problem, and it will kill any pricing model you try.
Simulate before you ship
The billing model is the easiest part of the transition. The hard part is everything it depends on, and those failures surface in quarter three or four, once contracts are written against the metric. Three passes, in order.
The manual billing simulation. Take your ten largest accounts, the proposed metric, and the last 90 days of actual usage. Compute by hand what each would have been billed and compare it to what you charged. Document every variance above 3 percent and trace it to its source.
Shadow billing. Run the proposed model in parallel for 60 to 90 days without charging anyone under it, and identify which segments pay more, which pay less, and by how much. With two or three candidates, shadow-bill them side by side.
Five customer conversations. Show five accounts across NRR cohorts their simulated invoice without explaining the metric first, and ask whether the charge feels proportional to the value they get. Top-NRR accounts should find it reasonable or low; bottom-NRR accounts should find it somewhat high. If you see the reverse, your metric is inverted.
Tessellate, an $18M ARR data integration platform, launched with none of the three passes. Its telemetry carried a 12 percent over-billing error from a double-counting bug, found four months later when a $240K enterprise account ran its own audit and turned up $28K in overbilling. The credit was the small cost. The account cut its scope by 40 percent at renewal, citing lost trust. The fix took three weeks. The trust repair took 14 months.
The 90-day usage-based pricing diagnostic lays these passes out as a four-phase checklist with day counts.
Three costs that eat the business case
The case for usage-based pricing is usually made with optimistic projections: NRR improves because heavy users pay more, expansion accelerates because the ceiling is gone. All of that can be true. None of it is guaranteed, and three costs are routinely left out.
Sales cycle extension. A consumption model without a committed floor adds weeks to every enterprise cycle in year one while buyers estimate usage they have never measured. A 45-day extension on a two-rep enterprise team takes a visible bite out of deal capacity before a dollar of expansion lands.
Customer success overhead. Managing consumption health is a new job with new processes, tooling, and skills. Budget for the capacity in year one, or plan for accounts whose declining consumption goes unmanaged until renewal.
Billing infrastructure. Most billing systems are not built for metered consumption with an enterprise-grade audit trail. Platform changes, integration, and telemetry validation are real engineering spend, and rarely in the initial case.
Build the full model. The gap between what your heaviest users pay and the value they get is the theoretical upside; model a capture rate, not the whole gap, because heavy users resist paying for what they used to get free. Set total transition cost, including churn from accounts that preferred the old model, against realistic capture over three years.
Saltmarsh, a $19M ARR cloud infrastructure company, modeled a $1.8M first-year upside and nothing else. Actual first year: $640K in additional expansion, $280K lost from four churned accounts that preferred predictability, $175K in engineering and billing cost, and a 38-day average cycle extension that delayed roughly $320K in closings. Net: about zero. Year two turned positive, but the year-one miss cost the pricing team six months of internal credibility.
Volatility, sales-cycle stretch, and the committed minimum
Pure consumption pricing is a fantasy sold by people who have never closed a renewal during a downturn. Real buyers need a forecastable line item. Real finance teams need forecastable revenue. Without a floor, revenue turns volatile with budget cycles, your heaviest users become your most cost-conscious and optimize usage down instead of growing into the product, and the sales motion loses its anchor because procurement will not sign an open-ended commitment.
Pinewire, a $20M ARR developer platform, moved from flat-rate to pure consumption after customers complained that flat-rate felt expensive in slow months. Enterprise cycles stretched from 68 to 112 days as procurement asked for usage estimates sales could not provide, and NRR fell from 108 to 93 percent as normal variability turned into contraction. After 18 months Pinewire rebuilt as commit plus consumption, with the commit at about 60 percent of expected usage. Cycles came back to 74 days and NRR recovered to 107 percent over three quarters.
Ochre Data, a $26M ARR data enrichment platform, learned the behavioral half. Its 15 largest accounts, 38 percent of ARR, were already at the ceiling of their use case, and under a meter they optimized down, not up, renegotiating at renewal on usage data that showed they had been over-contracted. NRR went from 104 to 88 percent in the first year. A subscription base plus usage overage stabilized it at 97 percent, after 18 months of damage.
The hybrid is three knobs.
The fixed floor. A committed minimum on every contract, set below expected usage so a healthy customer regularly reaches overage. Stellare's was $18 per truck per month, budgeted by the fleet manager as a line item tied to a number they already track. Set the floor too high and you have reinvented the seat with extra steps. Set it too low and you have rebuilt pure consumption with a fig leaf.
The variable meter. Stellare's was the 2.4 percent take rate on parts orders. The overage rate matters as much as the metric; a16z calls overages the overlooked problem in usage-based pricing, and a punitive rate turns expansion into a dispute. Publish the rate in advance, keep it close to the base rate, and treat every overage invoice as a signal about the customer's growth rather than a penalty for it.
The cap or collar. Stellare's was implicit. Anya's sensitivity analysis showed the hybrid could not produce an invoice above 1.4 times the prior flat fee in any realistic scenario, so she skipped an explicit cap that would have signaled defensiveness. Nagle and Müller in The Strategy and Tactics of Pricing call this collaring through architecture: the cap lives in the math, not in a clause.
Then run the business on committed ARR, the minimum annual value contracted across the base, with consumption above it as upside, so a slow quarter does not read as a retention crisis. If quarterly revenue variance exceeds what your operating plan can absorb, or most of your revenue has no floor under it, you are carrying more risk than a business with enterprise buyers should.
The test of a well-designed hybrid is whether a customer can predict next month's invoice from two data points and their own operating plan. If they need a spreadsheet, the hybrid is wrong. Packaging beats pricing, and the hybrid is a packaging decision dressed up as a pricing decision. a16z's piece on predictability makes the same point from the buyer's side.
The usage dashboard ships before the first invoice
Usage-based pricing needs telemetry before it needs a price. That builds on the core stance: the predictable revenue problems it creates are, more often than not, telemetry problems wearing a pricing costume. Customers will not pay variable prices for something they cannot see. If they cannot watch usage translate into cost, they assume the worst and either churn or cap usage artificially.
The rule is simple. The customer-facing usage dashboard ships before the first invoice under the new model and runs in customer hands for a full quarter before pricing changes. It needs current usage against the commitment, a forecast of month-end spend, and budget alerts the customer configures at, say, 70 and 90 percent of the commitment. Usage anxiety drives churn. Usage visibility replaces anxiety with management. The instrumentation discipline behind it is the subject of the telemetry-before-features guide.
Three internal tools ship alongside it. A sales forecasting tool that turns account size and use case into an expected annual spend range, without which reps quote minimums to close faster. A CS consumption health score, because declining consumption is a churn signal, and thresholds are easier to build before launch than to retrofit onto a live book. And a comp plan that pays on the annual commitment at close with a quarterly true-up for realized usage, because reps on the old plan sell the minimum and leave all expansion to a CS motion nobody staffed.
If you are already live, pull your last four quarters of overage invoices and check what share generated a CS escalation or a renegotiation request. If it is more than one in five, your overage rate or your usage visibility is the problem, and the fix is on the dashboard side before the pricing side. If you are still deciding, settle the commitment structure and the dashboard before you finalize the metric. The value-based pricing guide covers why the value conversation precedes the number, and the willingness-to-pay concept page covers how to research the buyer's budgeting unit.
Rollout with rollback gates named in advance
Every rollout carries the same risk. A block of customers sees an invoice they did not expect, the sharpest reactions cluster in the segment that loses the most, and within two weeks the rollout is paused, negotiated into mush, or pushed through with exceptions that corrupt the meter.
The fix is pre-signed rollback gates: three of them, agreed in writing by pricing, CS, finance, and the CEO, before the first invoice moves. Stellare's were specific. Gate one, churn: if rolling 30-day logo churn crossed 2.5 percent, new cohort transitions paused until CS ran root-cause interviews. Gate two, revenue: if recognized MRR under the new meter fell below 97 percent of baseline for two consecutive weeks, the meter reverted for affected cohorts. Gate three, tickets: if billing-related tickets exceeded three times the trailing 90-day baseline, the CS VP escalated to the CEO and a 48-hour review triggered.
The rollout ran 91 days across three cohorts. Gate three fired once, in week four, when mid-size fleets hit an edge case where the take rate on a bulk parts order was presented badly on the invoice. The fix was an invoice redesign, not a meter change, and the gate caught a communication failure before it became a churn event. Fourteen fleets churned, 1.7 percent of the base. NPS rose nine points. Sixty-two percent of fleets expanded parts attach within 60 days. Annualized revenue lift was 28 percent.
Existing customers get a bridge, not a cliff. Offer top accounts a parallel option for 12 to 18 months with voluntary migration, and lead the communication with the customer's invoice delta, not the meter design. A cohort impact table by customer size, with predicted and bounded invoice changes, is the artifact that decides whether the rollout survives its first month.
Diagnostic questions
Answer these in writing before the pricing committee meets. Blank answers are answers.
- Does usage intensity separate your top NRR quintile from your bottom, and which candidate metric shows the steepest gradient?
- Does the chosen metric pass all three tests: observable by the customer, rising with success, forecastable before signing?
- Has a customer-facing usage dashboard with forecasts and alerts run in customer hands for a quarter?
- Have the ten largest accounts been manually simulated against 90 days of real usage?
- Do the top 30 accounts pay more or less under the proposed model than they paid last year?
- What share of total ARR is committed, and does the comp plan pay on commitment with a true-up?
- Are the three rollback gates written, numeric, and signed, and can an acquirer's CFO model the base on your exit horizon?
Common mistakes
Each of these has a name and a price tag.
The meter as complexity tax. Nested tiers, volume thresholds, decay curves, bundled credits. The invoice needs a legend, and churn creeps up among customers who did not complain; they just left. If CS cannot explain the meter in one sentence, strip tiers until it can.
Launching before telemetry is stable. Ashgrove, a $35M ARR platform, launched consumption pricing on a beta dashboard. Seven top accounts demanded a return to flat fee within 90 days.
Forcing the cutover. Fernhill, at $50M ARR, required every customer to migrate within 120 days. The top cohort generated 18 percent logo churn during the transition.
No floor. Coppice, a $20M ARR platform, ran pure usage because sales wanted to compete on "you only pay for what you use." Quarterly revenue variance hit 27 percent, the CFO lost forecast credibility with the board, and the company reverted to a hybrid within a year.
Old comp plan on the new model. Reeve Analytics, at $40M ARR, changed the pricing and not the plan. Reps sold minimum commitments only, and the expansion the business case promised sat in the product, unsold.
The 30-60-90 sprint for usage-based pricing readiness
Days 1 to 30. Run the archetype audit and kill the bad meter candidates. Document the three archetype questions with evidence. Interview 8 to 12 customers across the size distribution. Pull the NRR quintile analysis, score four to six candidates against five to seven criteria, and eliminate anything that fails on comprehension or gameability. The output is a shortlist of one or two metrics and an archetype memo any executive can defend to the board.
Days 31 to 60. Design the hybrid and simulate. Set the floor, the meter, and the collar. Run the manual billing simulation on the ten largest accounts, then shadow-bill the base and present the cohort waterfall. Run the five customer conversations. Name the three rollback gates in numeric terms and get the CEO, CFO, CRO, and VP of CS to sign them. A gate that is not signed is not a gate.
Days 61 to 90. Ship the dashboard, then the first cohort. The usage dashboard, the forecasting tool, the CS health score, and the revised comp plan go live before any invoice changes. Start with the lowest-risk cohort, usually the mid-size segment where the invoice delta is smallest, with the gates visible to pricing, CS, finance, and the CEO. Expand only when all three gates sit in green for ten trailing days. Operators who protect the rollout with telemetry rather than hope get the lift without the renewal book damage.
Where to go from here
If you are deciding whether to move, write the archetype memo first and the meter second. If you are already live and the numbers are wobbling, check the committed share of ARR and the overage escalation rate before you touch the metric. The metric is usually fine. The floor and the dashboard usually are not. If the meter is for a product that has not launched yet, pricing and packaging a new product covers the cohort test that decides it.
Book a usage-based pricing working session or Score your pricing readiness.
References
- Nagle, Thomas T., and Georg Müller. The Strategy and Tactics of Pricing. 6th ed. Routledge, 2018.
- Ramanujam, Madhavan, and Georg Tacke. Monetizing Innovation. Wiley, 2016.
- Simon, Hermann. Confessions of the Pricing Man. Copernicus, 2015.
- Mohammed, Rafi. The 1% Windfall. Harper Business, 2010.
- Smith, Tim J. Pricing Done Right. Wiley, 2016.
- Parker, Geoffrey G., Marshall W. Van Alstyne, and Sangeet Paul Choudary. Platform Revolution. W.W. Norton, 2016.
- Bush, Wes. Product-Led Growth. Product-Led Institute, 2019.
- a16z. "Usage-Based Pricing Is Popular, But Is It Right For You?" https://a16z.com/usage-based-pricing-rule-of-thumb/
- a16z. "Customers Want Predictability in Usage-Based Pricing. Here's How to Help Them Get It." https://a16z.com/customers-want-predictability-in-usage-based-pricing-heres-how-to-help-them-get-it/
- a16z. "Overages: The Overlooked Problem in Usage-Based Pricing." https://a16z.com/overages-problem-usage-based-pricing/
Company names and figures in worked examples are illustrative or changed to protect client confidentiality.
Questions, answered
8 QuestionsWhen does usage-based pricing make sense?
It makes sense when customer value scales with a countable unit the customer already understands, when your cost to serve scales with that same unit, and when buyers would rather pay as they consume than commit up front. A useful shortcut: if the end user of your product is software, a meter is probably natural; if the end user is a person at a desk, the seat is usually already a decent proxy for value. Stellare Telemetry found two of the three conditions held, which was enough to move to a hybrid, not a full consumption flip.
Seat-based or usage-based: how do you decide?
Run the archetype test before the meter test, then check the data. Pull your top and bottom quintiles by net revenue retention and see whether usage intensity separates them; if it does not, a meter will redistribute revenue without creating expansion. Then model your top 30 accounts under the proposed model against what they paid last year. If the median pays less, the switch is a price cut for your best customers, not a growth play.
How do you choose a value metric for usage-based pricing?
Separate the value metric, what the customer buys the product to achieve, from the usage metric, the proxy you bill against, and pick the proxy that tracks the outcome rather than the activity. The metric has to pass three tests: the customer can observe it without your help, it rises when the customer succeeds rather than when they are inefficient, and the customer can forecast it before signing. Rank candidates by how steeply they climb across NRR quintiles, then shadow-bill the top two or three before you commit.
How do you protect revenue predictability under usage-based pricing?
Put a committed minimum on every contract, set slightly below expected usage so healthy customers reach overage regularly, and run the business on committed ARR rather than trailing consumption. Publish the overage rate in advance and keep it close to the base rate, because punitive overages turn expansion into disputes. Ship a customer-facing usage dashboard with forecasts and self-serve alerts before the first invoice, so the buyer can predict their bill from their own operating plan.
Should you go fully consumption-based or keep a fixed-fee floor?
Keep a floor. Pure consumption rarely survives contact with a finance team that needs a forecast or a procurement team that needs a contract value. A hybrid with a fixed platform component and a variable meter gives the buyer a predictable base and gives you forecastable ARR with upside that scales with customer success. Stellare settled on a per-truck platform fee plus a 2.4 percent take rate on parts orders.
What has to be in place before the first usage-based invoice goes out?
Validated telemetry, a customer-facing usage dashboard that has run in customer hands for a quarter, a sales forecasting tool that turns account size into a spend range, a CS consumption health score, and a comp plan that pays on commitment with a true-up for realized usage. Before any of that, manually simulate your ten largest accounts against 90 days of real usage and trace every variance above 3 percent. The billing model is the easy part; everything it depends on is the work.
How do you move existing seat-based customers without bill shock?
Offer a parallel option for 12 to 18 months so top accounts can choose seat-based or the new model and migrate voluntarily. Lead every conversation with the customer's own invoice delta, not with the meter design, and build a cohort impact table by customer size with predicted and bounded changes. Name three rollback gates, for churn, revenue, and billing tickets, in writing before the first cohort moves.
How does usage-based pricing affect an exit multiple?
An acquirer's CFO models forward revenue. Committed ARR they can model earns a multiple, while a consumption base they cannot forecast gets discounted across the whole business, not just the variable slice. Inside 18 months of an exit, a hybrid that keeps committed ARR and captures some usage upside is usually the right design; a wholesale move to pure consumption belongs in the early years of a hold. On a $50M ARR business, one turn of multiple is $50M of enterprise value, which is why the volatility question matters more than the expansion story in diligence.
Usage-based pricing is an architectural choice, not a pricing tactic. It fits some archetypes and actively harms others. This guide is the diagnostic that tells you whether UBP fits your business, how to pick the meter that tracks customer-realized value, how to design a hybrid that protects predictability for both sides, and how to roll it out with rollback gates named in advance.
How relevant and useful is this article for you?
About the Author(s)
 Emily Ellis is the Founder of FintastIQ. Emily has 20 years of experience leading pricing, value creation, and commercial transformation initiatives for PE portfolio companies and high-growth businesses. She has previous experience as a leader at McKinsey and BCG and is the Founder of FintastIQ and the Growth Operating System.
Further reading
- Madhavan Ramaswamy & Georg Tacke. Monetizing Innovation. Wiley, 2016
- Wes Bush. Product-Led Growth. Product-Led Institute, 2019
- Thomas Nagle & Georg Müller. The Strategy and Tactics of Pricing. Routledge, 2016
- Rafi Mohammed. The Good-Better-Best Approach to Pricing. Harvard Business Review, 2018
- OpenView Partners. SaaS Benchmarks Report. OpenView Partners, 2023
- a16z. Usage-Based Pricing Is Popular, But Is It Right For You?. ↗
- a16z. Customers Want Predictability in Usage-Based Pricing. Here's How to Help Them Get It.. ↗
- a16z. Overages: The Overlooked Problem in Usage-Based Pricing. ↗