
$148K of WTP Research Into $1.2M of First-Year Lift
Willingness-to-pay research is usually treated as a single methodology. The operators who extract revenue from it run multi-instrument programs matched to the channel and to the decision. This guide walks through the four-channel program Antler & Forge Beverage ran across DTC, specialty retail, restaurant wholesale, and duty-free, then folds in the B2B software variant: the evidence already in your CRM, why stated preference misleads in both directions, what to do in a category with no benchmark, and how findings become list price, discount floor, and tiers.

The Operator's Guide to Willingness-to-Pay Research Across Commercial Archetypes
Most willingness-to-pay research fails not because the math is wrong but because the operator asked one channel's question and applied the answer to four channels, or asked a survey question and treated the answer as a price. It is the single most expensive habit in commercial pricing, and it is still the default in companies that have otherwise professionalized everything else.
TL;DR
- Channel dictates instrument. There is no universal WTP method; DTC, specialty retail, restaurant wholesale, duty-free, and B2B software each answer a different question and need a different tool
- Triangulation beats precision. Two imperfect methods that overlap are more reliable than one method that claims high confidence
- The evidence you already own comes first. In B2B software, 24 months of deal data and 20 deal debriefs usually beat a $65K survey, and they cost two weeks
- Stated preference misleads in both directions. Customers anchor low, fans anchor high, and only behavior settles it
- WTP research fails in new categories because the benchmark does not exist yet. Cost the workaround instead of surveying the price
- Pricing decisions come from the narrowest overlap. Set list at the 70th percentile of the segment's distribution, the floor where conversion stops responding, and the tiers around the bands the research shows you
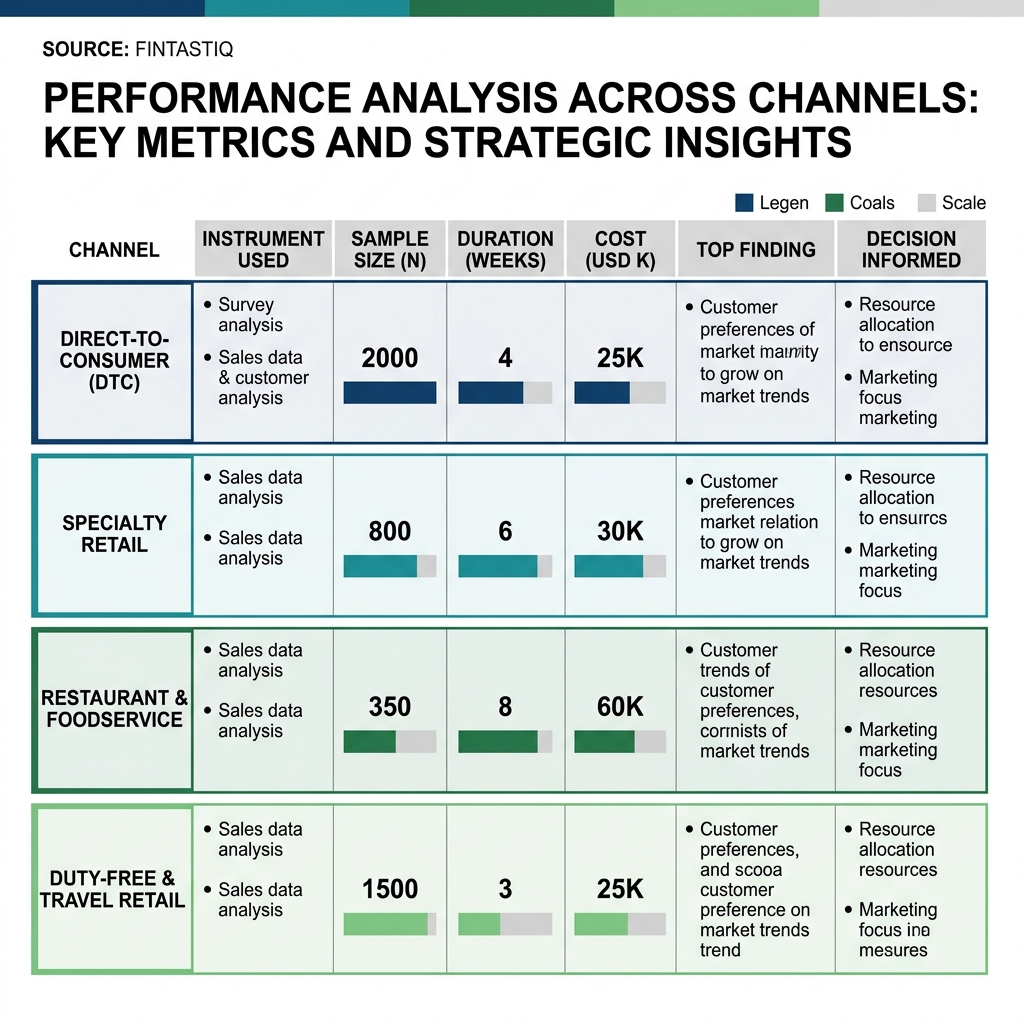 Exhibit: Four-channel WTP instrument matrix
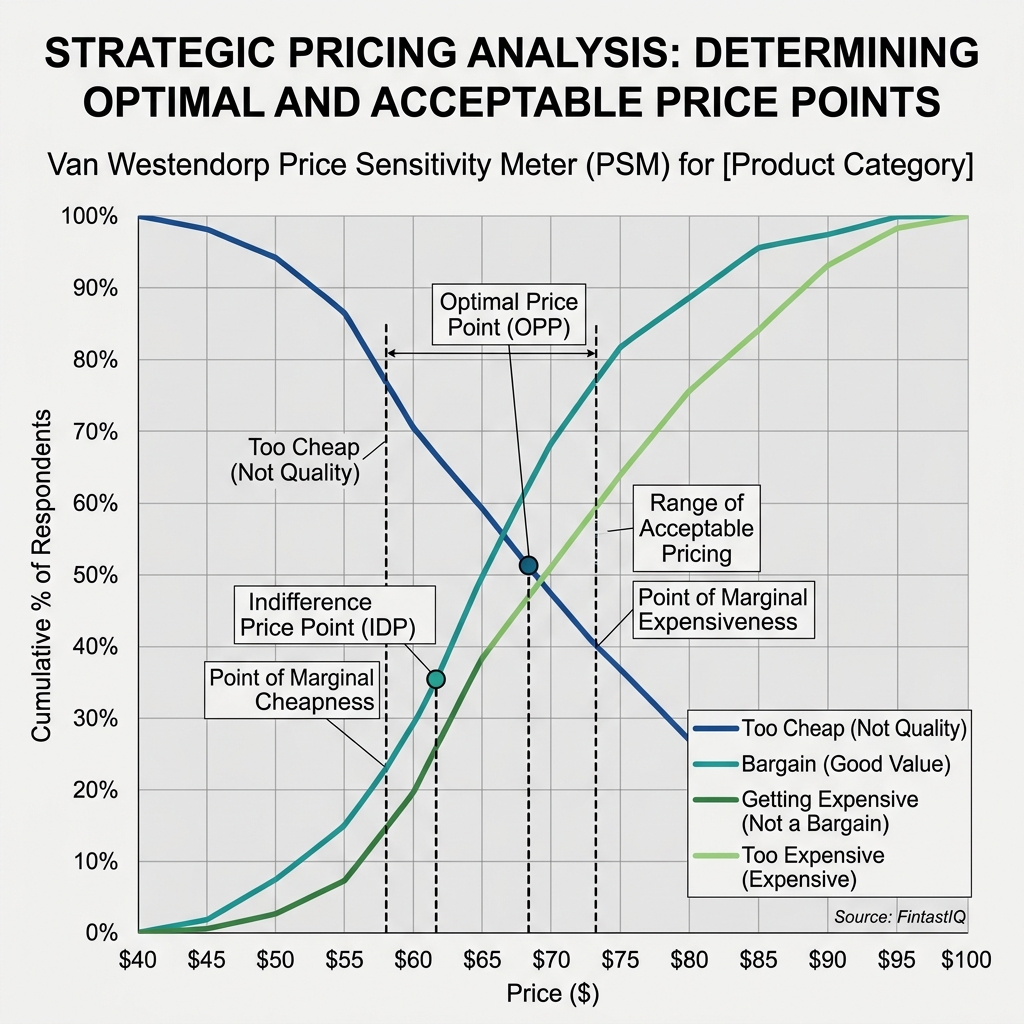 Exhibit: Van Westendorp composite for flagship SKU
The core problem
Antler & Forge Beverage is a 55-person craft spirits house doing $24M in revenue across four channels: 38% DTC, 32% specialty liquor retail, 22% restaurant and bar wholesale, and 8% duty-free. Their portfolio is 180 SKUs across three price tiers: a $38 everyday expression, a $72 flagship, and a $145 limited release. They serve 820 restaurant accounts, 240 specialty retailers, and maintain duty-free presence in 18 countries.
Mikhail, the Head of Commercial at Antler & Forge, inherited a pricing architecture built on intuition and importer feedback. Every channel was being priced against a different unspoken assumption, and nobody on the team could articulate why. When he pushed on the flagship's $68 price point, the answer came back as "that is what the market will bear." Nobody could say which market, which buyer, or which purchase occasion.
Confusion is the enemy of willingness to pay. Before a number can be defended, the question underneath it has to be sharpened until it has exactly one interpretation. Mikhail's starting move was not to commission research. It was to list, channel by channel, the specific pricing decision he needed to make. That list forced the instrument choice that followed.
The same discipline applies whether you sell spirits or software. The concept page on willingness to pay covers the definition and the revenue architecture it drives. This guide is about running the research so it changes a price.
Part one: channel dictates instrument
A DTC buyer browsing a Sunday email is not the same decision-maker as a sommelier building a by-the-glass program, and neither resembles the duty-free traveler choosing a gift in a twenty-minute layover. Each has a different reference set, substitutes, decision horizon, and social signal. Pricing is a signal before it is a number, and the signal is read differently in each aisle.
Antler & Forge ran four instruments in parallel, each matched to the channel's decision structure:
- DTC flagship: Van Westendorp PSM paired with a choice-based conjoint, n=840 from the house list and a matched lookalike panel
- Specialty retail: a 14-person retailer panel of store owners and category buyers, combined with a shelf scan-data regression across 240 accounts
- Restaurant and bar wholesale: 22 sommelier and beverage-director ride-alongs, paired with a menu-placement A/B across 48 accounts
- Duty-free: a traveler-intercept survey at four airports, n=380, stratified across inbound, outbound, and transit travelers
Each instrument answered a question the others could not. The retailer panel surfaced shelf economics no consumer survey can see. The ride-alongs surfaced the rebottling-story narrative no conjoint attribute list could have anticipated. The intercept caught impulse, gift, and ritual triggers that only emerge in the physical environment. Together, the DTC Van Westendorp and conjoint triangulated a defensible flagship optimal.
Part two: the instrument library
An operator running a serious WTP program should know the instruments cold, and know which question each is designed to answer. The first five belong to consumer and channel work. The last four are where B2B software programs should start.
- Van Westendorp PSM: four questions about what the buyer considers too cheap, a bargain, expensive, and too expensive. Best for an acceptable-range read on a known product. Weak on trade-offs, and biased unless each question is anchored to a quantified scenario
- Choice-based conjoint: buyers choose between bundles at varying prices. Best for isolating WTP for a specific feature and designing tiers. Weak when the real purchase driver sits outside the attribute list, and invalid in a category buyers cannot yet evaluate
- Shelf scan-data regression: point-of-sale data used to estimate elasticity. Best for specialty and mass retail. Weak for new products and limited releases
- Qualitative ride-along: sits with the buyer in their own environment. Best where the purchase is a relationship. Weak on projectability
- Traveler intercept: captures the buyer at the moment of consideration. Best for duty-free and airport. Weak on sample control
- Deal and renewal data mining: 24 months of closed deals, first-price acceptance versus rep-initiated discount, and the renewal price at which negotiation starts. Best for any B2B product with 50 or more closed deals. Weak on latent WTP that better packaging would unlock
- Deal debriefs and reference-price interviews: 20 to 30 structured conversations with recent wins, losses, and buyers per segment that ask about outcomes, alternatives, and the cost of not solving the problem. Best for new categories and for separating price objections from value objections. Weak on projectability without a second instrument
- Behavioral usage signals: feature adoption velocity, usage frequency against the churn curve, and the mix of expansion-oriented versus troubleshooting support tickets. Best for targeting price increases and expansion, continuously. Weak as a standalone read on list price
- Controlled price test: two prices to matched inbound cohorts for 90 days, tracked on signed deals. Best for homogeneous segments with steady flow. Weak where deal flow is lumpy or rep-driven
The best operators compete on discipline, not instinct, and discipline starts with refusing to use an instrument outside its design envelope.
Part three: triangulation and why single-method studies fail
Antler & Forge's most expensive prior mistake was a single-method study. Two years before Mikhail joined, a conjoint-only DTC study returned an optimal flagship price of $85. The team lifted the price. DTC held. Restaurant accounts did not: forty-one delisted within the quarter because the wholesale price implied by $85 retail pushed the by-the-glass pour past the $18 ceiling operators in that tier defended.
The study was not wrong. The question was wrong. The conjoint measured DTC willingness to pay and was asked to stand in for a four-channel pricing decision. A parallel failure: a pure Van Westendorp study on the limited release that said $160 and missed the duty-free ceiling at $180. An underpriced product is as expensive as an overpriced one, just quieter.
Triangulation is the correction. The DTC Van Westendorp composite identified a flagship range of $66 to $78 with an optimal around $74. The conjoint returned an independent optimum of $70. The retailer panel converged on $72. The sommelier work confirmed $72 retail translated to a defensible by-the-glass pour. Four instruments, one overlap: $72. The new price went live at $72, a 4% lift from $68, and held across every channel.
Part four: the B2B software variant, the evidence you already own
Software companies commission surveys for a question their CRM has already answered. Your deal history is a behavioral record of willingness to pay, and it is the cheapest instrument in the library.
Pull every deal closed in the last 24 months. For each, record the list price offered, the final contracted price, the number of negotiation rounds, and whether the customer asked for the discount or the rep offered it. Deals accepted at the first price with minimal negotiation are your most reliable WTP signal. Deals where the discount was rep-initiated are noise about the rep. Then read renewals the same way: the price at which 80 percent of accounts renew without negotiation is your current floor, and the price at which 40 percent begin to push back is your current ceiling. That range is more accurate than any survey you could field this quarter.
Anselm Analytics, an $11M ARR analytics platform, had not changed its price since launch three years earlier. The founders remembered two early deals that required heavy discounting, and those two deals had become the anchor for every pricing conversation since. A three-week audit of the CRM found that discount rates over the prior 18 months averaged 8 percent, well below the 20 percent level where sales teams usually signal pricing pressure; that win rates had been rising, not falling; and that the segment those two deals came from was now 6 percent of pipeline. The company raised prices 25 percent. Win rate dipped one point the following quarter and recovered fully within six months. Annual ARR growth accelerated from 34 to 51 percent. The data had been there the whole time. Nobody had looked.
The second thing deal data reveals is that WTP splits by buyer, not by company size. Cairnwood Data, a $21M ARR data governance platform, had held the same pricing for four years while the board debated an increase before an exit. The sales leader was against it on competitive grounds; the CFO was for it on cost grounds; neither had evidence. An analysis built on deal data and 14 structured customer interviews found that WTP ran from $18K to $95K a year depending entirely on whether the buyer was a compliance officer buying audit coverage or a data engineering leader buying pipeline reliability. Pricing had been set for the compliance buyer, and the data engineering use case had quietly grown to 40 percent of the base. A tier by use case, with data engineering at 2.2x the compliance tier, lifted new data-engineering ACV 68 percent with no change in win rate and added $4.8M of ARR the following year.
The third source is product usage. Accounts that activate three or more features within 45 days and keep using them have embedded the product in several workflows and carry a switching cost that translates directly into WTP. Accounts above the usage frequency where your churn curve flattens are weighing your price against disruption, not against alternatives. Accounts whose support tickets have shifted from "how do I" to "can it also" are telling you they want more. The signal framework, and the targeted price increase it makes possible, is worked through in the behavioral signals post.
Build this as infrastructure, not as a study. Tessellate Analytics, a $12M ARR platform, raised a Series B and hired eight account executives with no documented WTP research, no segment pricing rationale, and no deal desk rules. Within nine months average ACV had fallen 22 percent as the new reps discounted to quota. The company then paid $400,000 to a pricing consultant whose first recommendation was a six-week WTP study built on data already sitting in their CRM. Every new rep is a new discount decision. Read the data before you hire, not after.
Part five: when stated preference lies
A stated price carries no consequence, and the bias runs in both directions. Current customers who suspect the survey will set their renewal price anchor low, which understates WTP. Fans and prospects asked whether an increase is "reasonable" say yes with nothing at stake, which overstates it. Self-selected respondents are your most engaged accounts, so the sample is skewed before the first question. Which way the error runs depends on who you asked and how. Only behavior settles it.
Lanternwood Learning, a $14M ARR learning platform, ran a comprehensive study before a redesign: 200 surveys, 15 interviews, and a Van Westendorp. The acceptable price came back at $320 a seat against a current $265. They repriced to $310, comfortable inside the range. Twelve months later a competitor entered at $380 with comparable depth and started winning deals. Exit interviews on three lost deals said the higher price was read as a signal of quality, not a deterrent. Lanternwood then read its own renewal-without-negotiation data and add-on attach by tier, which pointed to a ceiling of $420 to $480. They repriced to $399 with a clear value message. Conversion held, and ARR went from $14M to $21M over 18 months. The survey had priced them below the market-clearing level and called it caution.
Sablewood Software, a $16M ARR vertical SaaS company, made the opposite error. A survey before a planned increase found that 80 percent of respondents would find a 20 percent increase acceptable, so the company took 18 percent across renewals and new business. New-business win rate fell 14 points the following quarter. Renewals held at 88 percent, but the 12 percent that resisted had been the highest-expanding accounts. The post-mortem was short: respondents were self-selected current customers with relationship goodwill that new prospects did not share, and the 20 percent was a stated tolerance with no outcome attached. A redesign using deal debriefs and an anchored Van Westendorp produced a segmented increase, 18 percent on renewal where goodwill supported it and 7 percent on new business, and win rate recovered within two quarters.
Two corrections make survey instruments usable. First, anchor every question to a scenario with a quantified outcome ("at this price you would remove roughly X hours of manual work a week") rather than to an abstract number. Second, field to a sample that looks like your next customer. Antler & Forge matched a lookalike panel to its house list for the DTC study; the lookalike WTP came in $4 lower than the loyalists', and the lookalike number is the one they used.
Part six: new categories, where the benchmark does not exist yet
Willingness-to-pay research fails in new categories because the benchmark does not exist yet. Every survey instrument assumes a reference set: products the buyer has compared, prices they have seen, trade-offs they have made. Remove the reference set and the instruments keep producing numbers, but the numbers describe the adjacent category the buyer reached for or the budget line they happen to own. Van Westendorp responses cluster at round numbers. Conjoint measures trade-offs between attributes nobody has yet learned to trade off.
Docket & Vale, a $17M ARR legal tech platform two years in market, ran a conjoint to set tiers in what it believed was a maturing category. The output was clean: $299, $799, and $1,499 a month. Win rate dropped 18 points the quarter after launch. Buyers were not choosing between feature sets. They were choosing whether to buy at all, because the category was still being defined. A ten-interview study run afterward found the primary objection was implementation risk, not price. Buyers did not need a lower number. They needed a pilot structure that lowered the perceived risk of starting.
What to do instead. Run reference-price interviews and cost the workaround: what the buyer does today to get the job done, in hours, headcount, tools, and risk, and which budget line a solution would come from. Build a value-in-use model for three real accounts rather than a spreadsheet average. Price a pilot that lowers the risk of starting, because in a forming category the objection is usually risk wearing a price costume. Run one cohort test with one variable. And book the re-measurement for 12 months out, once real renewal and usage behavior exists to read. The launch sequence is in the new product pricing and packaging guide.
Part seven: pricing decisions from WTP findings
Research produces findings. Findings do not produce prices. The translation is where most programs quietly waste their budget.
Antler & Forge's four-channel program produced three decisions:
- Flagship lifted from $68 to $72, a 4% move validated across DTC, specialty, restaurant, and the retailer panel. First-year DTC contribution: $640K
- Restaurant accounts were offered a rebottling-story SKU at $88, built from the sommelier finding that restaurants would pay a premium for a pour with a narrative staff could tell tableside. First-year restaurant lift: $310K
- Duty-free limited release priced at $175, five dollars under the $180 ceiling the intercept survey identified. First-year duty-free lift: $250K
Total first-year lift: $1.2M against $148K over 14 weeks. The ROI is not the headline. The headline is that the same operator, asking a different question, would have produced a different number. The program's discipline came from refusing to take any single instrument's answer as final.
In B2B software the translation has four steps. Set list price at the 70th percentile of the target segment's WTP distribution, not the median; the median leaves money with the top half of the segment and still needs discounting to close the bottom. Set the discount floor where conversion stops responding to price, and hand reps the acceptance threshold for their segment: a rep who knows that 90 percent of mid-market accounts in the vertical accept above $85K anchors at $120K and concedes to $90K, where a rep with no idea starts at $95K and panics to $70K. Anchor the Better tier in the 50th to 70th percentile of the core segment, where the compromise effect works for you. Cap the Best tier at the ceiling of the highest-value segment, so expansion under a usage-based model does not trigger a renewal shop. The tier mechanics are in the good-better-best guide and the SaaS packaging framework; the value side of the equation is in the value-based pricing paper.
Quillon Software shows what the translation is worth. A $57M ARR company had never run formal WTP research; prices were set by benchmarking two competitors and sitting 10 percent below their average. A new revenue leader funded a $22K conjoint across 120 customers. It found three things: the enterprise tier's ceiling sat 38 percent above its current price; the feature set customers valued most was buried in an enterprise tier that only 18 percent of customers were on; and 60 percent of mid-market customers described the growth tier as "about right," which is what a 12 to 15 percent increase without resistance looks like from the inside. The company repriced enterprise 28 percent higher, moved the key features into the growth tier, and raised the growth tier 12 percent. Net ARR impact over four quarters: $6.8M. Not every study returns that. Every study should be scoped so it could.
Pricing maturity is measured by what you stop doing. Mikhail stopped three things: translating DTC findings directly into wholesale list prices, treating conjoint output as a decision, and running studies without pre-registering the decision they were meant to inform.
Part eight: decision first, budget second
Your CFO approved the last pricing study because the argument sounded reasonable. Your sales leader approved it hoping the output would give reps conviction. Nobody was asked to model what it would return. Build that model first, because it tells you how precise the findings need to be, how fast you need to implement, and whether the study is worth running at the proposed scope.
Write the decision in one sentence. "Should we raise the enterprise tier from $2,500 to $3,200 a month for accounts above 200 seats" is a decision. "We need to understand our pricing strategy" is a research tax. Then model three scenarios: no change; a conservative outcome where a 10 percent increase holds with 3 points of incremental churn; and a base case where 20 percent holds with 5 points. Count the months between findings and the first contract at the new price, because every one of them is a month at the old price. On the numbers: a $25M ARR business 15 percent below its ceiling forgoes about $3.75M a year, so six months of research and three of implementation cost roughly $2.8M in delay alone. A $50,000 study that ends nine months of underpricing returns many times its cost. The same $50,000 on findings too vague to act on returns nothing. McKinsey's long-standing estimate that a 1 percent price improvement lifts operating profit by around 11 percent is the reason the delay cost dominates the research cost every time.
Ironbark Software, a $35M ARR vertical SaaS company, spent five months and $65,000 on a WTP study and received a 90-slide deck recommending a "tiered value-based approach" with no price points and a suggestion to test further. Six months later, a three-week internal analysis of deal desk data plus ten customer calls found the mid-market tier 30 percent underpriced against the value metric customers actually tracked. They raised it. Net revenue retention moved from 104 to 117 percent over the following year. The difference was not the budget. The first study had no hypothesis to test and no decision rule set in advance.
Greyhaven Systems, a $32M ARR platform, commissioned a $95,000 study that was thorough and right: the growth segment would support a 28 percent increase. Implementation needed new deal desk governance and retraining for 22 reps, and nobody had planned that workstream. Eighteen months passed before the first contract at the new price, and roughly $5.4M went unclaimed in the gap. A two-week implementation planning sprint before the research started would have been the best-returning line in the budget.
The cost ladder, so you can size the decision: an internal pull from CRM, deal desk, and billing data costs 40 to 80 analyst hours. A structured external study with interviews and quantitative modeling typically runs $25,000 to $75,000 over four to six weeks. A full conjoint program with representative samples runs $80,000 to $200,000 or more. The minimum credible evidence set for a B2B price change is smaller than any of those: discount rate by segment from the deal desk, five to eight win-loss interviews with recent losses where price was cited, and a revenue model under three churn scenarios. Three to four weeks, no external spend. Commission more only when the decision needs more.
Five failure modes
- Method monoculture. Running one instrument across all channels or all buyers. Every channel outside the instrument's design envelope ends up priced by analogy, and analogy is the most expensive form of pricing
- Sample of loyalists. Surveying the house list or the install base and calling it a WTP read. Loyalists reveal the ceiling of the existing customer, not the ceiling of the next one. Sablewood paid 14 points of win rate for this, and Antler & Forge's lookalike panel came in $4 under its loyalists
- Straight translation. Treating survey output as the price. WTP is an input to a decision that also has to absorb channel margin, promotional cadence, competitive reference sets, and psychological thresholds such as the $18 pour, the $100 gift, and the $200 luxury line that survey instruments miss
- Conjoint before the category forms. Measuring trade-offs between attributes buyers have not yet learned to trade off. Docket & Vale paid 18 points of win rate and learned the objection was risk, not price
- Findings without an implementation owner. A correct study that waits 18 months for governance and enablement is a correct study that cost $5.4M. Plan the implementation workstream before the research starts, not after it ships
The 90-day program
Ninety days is enough for a decision-ready cycle, and waiting has its own bill: a $15M ARR company 20 percent below its optimal price loses about $750,000 a quarter. Orrin HR, a $9M ARR platform, ran its study for 18 months; by the time findings shipped, four of its eight interview subjects had churned and the competitive landscape had moved. They had designed a conjoint before running the internal audit that would have shown their highest-value segment was identifiable from CRM data alone.
Days 1 to 21: audit and pre-register. List every pricing decision the program must inform, channel by channel or segment by segment. For each, write the question the instrument must answer and the decision rule that will convert the output into a price. If the rule cannot be written in advance, the study is not ready. In parallel, pull 24 months of deals with first price, final price, buyer persona, and segment, and calculate discount rate by segment, rep, and deal size. If top-quartile and bottom-quartile discount rates differ by more than eight points, you already have your first finding.
Days 22 to 60: run instruments in parallel. Sequential studies leak budget and let early findings bias later ones. Antler & Forge ran all four instruments across weeks 4 to 10. In B2B software this phase is 10 to 15 structured win-loss interviews on one protocol, asking about the moment price felt right or wrong and what the alternative would have cost, plus whichever survey instrument the decision needs, anchored and fielded to a lookalike sample. Parallel fielding forces triangulation into the analysis plan.
Days 61 to 90: triangulate, decide, document. Build the overlap chart: every instrument's range on one axis, the proposed price on the other. The price lives in the narrowest overlap. Write the updated hypothesis with a direction and a magnitude, model 12 months under three churn scenarios, and apply the decision rule you wrote in week one: if modeled loss exceeds 12 percent, change the packaging, not the price. Document the change, the rationale, the grandfathering policy, the governance that protects it, the enablement a rep needs when a prospect asks why pricing changed, and the 90-day metrics with an owner for each. Document what was rejected as carefully as what was decided, and book the re-measurement.
Company names and figures in the worked examples are illustrative.
Where to start
If you are an operator: before commissioning the next WTP study, write the exact pricing decision you need to make, channel by channel or segment by segment. If you cannot write it in one sentence per decision, the study will waste its budget. Then pull your last 50 closed deals and count how many closed at or near list without a rep-initiated discount. If fewer than a quarter did, you have a calibration problem, and that is the brief.
If you are building a pricing function from scratch: run the 90-day program in parallel, not in sequence. Pre-register decision rules, triangulate across at least two instruments per decision, and document rejections as carefully as conclusions. The asset is the discipline; the revenue lift is the receipt. The broader model choices sit in the SaaS pricing strategy guide.
Book a discovery call or Score your pricing readiness to apply this framework to your own numbers.
References
- Nagle, T. and Müller, G.: The Strategy and Tactics of Pricing, 7th ed.
- Smith, T.: Pricing Done Right.
- Mohammed, R.: The Art of Pricing.
- Simon, H.: Confessions of the Pricing Man.
- Dolan, R. and Simon, H.: Power Pricing.
- Ramanujam, M. and Tacke, G.: Monetizing Innovation.
- Hinterhuber, A.: Pricing and the Sales Force.
- McKinsey: "The power of pricing": https://www.mckinsey.com/capabilities/growth-marketing-and-sales/our-insights/the-power-of-pricing
- HBR: "A Refresher on Price Elasticity": https://hbr.org/2015/08/a-refresher-on-price-elasticity
- Simon-Kucher: "Global Pricing Study": https://www.simon-kucher.com/en/insights
- ESOMAR: "Pricing Research Guidelines": https://esomar.org/knowledge-center
- NielsenIQ: "Pricing and Promotion Measurement": https://nielseniq.com/global/en/insights/
- Journal of Revenue and Pricing Management: Van Westendorp and conjoint applications.
- HBR: "Pricing to Create Shared Value": https://hbr.org/2012/06/pricing-to-create-shared-value
Company names and figures in worked examples are illustrative or changed to protect client confidentiality.
Questions, answered
6 QuestionsWhy does willingness-to-pay research so often fail to produce real pricing lift?
Because the operator asks one channel's question and applies the answer to four channels, or asks a survey question and treats the answer as a price. A DTC buyer browsing a Sunday email is not the same decision-maker as a sommelier building a by-the-glass program, and a compliance officer is not the same buyer as a data engineering leader even when they buy the same software. Each has a different reference set, substitutes, and decision horizon. Instrument choice follows the decision and the buyer, not the researcher's preference.
When should you use choice-based conjoint versus Van Westendorp price sensitivity?
Choice-based conjoint is right when the product has multiple features that interact and buyers already trade off between them. It returns part-worth utilities and lets you simulate demand for specific bundles. Van Westendorp is a price sensitivity tool for a known product at varying price levels. Use conjoint to design the offer. Use Van Westendorp to pressure-test the price band. Use neither in a category buyers cannot yet evaluate.
What sample size makes willingness-to-pay research credible per channel?
For qualitative WTP interviews, eight to fifteen conversations per segment usually surface the decision logic. For choice-based conjoint among consumers, aim for 200 to 400 respondents per segment to stabilize part-worths. For B2B buyer conjoint, 60 to 120 qualified respondents is often enough if the segment is tight. Van Westendorp needs 150 to 300 respondents per segment for clean intersection points, and 30 per segment for a directional read.
How do you measure willingness to pay in B2B software without commissioning a survey?
Read the behavioral record you already own. Pull 24 months of deals and separate first-price acceptances from rep-initiated discounts. Read renewals for the price at which 80 percent accept without negotiation and the price at which 40 percent push back. Run deal debriefs with your last 20 wins and 10 losses, and reference-price interviews with 8 to 15 buyers per segment. Add product usage signals: adoption velocity, usage frequency, and expansion-oriented support requests. Most teams find three to five actionable pricing insights in that data within two weeks.
Why do stated-preference surveys mislead, and in which direction?
Both directions, depending on who you asked and how. Current customers who suspect the survey will set their renewal price anchor low. Loyal fans and prospects asked whether an increase is reasonable say yes with nothing at stake. Self-selected respondents are your most engaged accounts, so the sample is skewed before the first question. Anchoring each question to a quantified outcome and fielding it to a lookalike sample closes part of the gap. Behavior closes the rest.
What should you do when the category is new and no benchmark exists?
Stop surveying price and start costing the workaround. Reference-price interviews establish what the buyer does today to get the job done, what it costs in hours, headcount, tools, and risk, and which budget line a solution would come from. Build a value-in-use model for three real accounts, price a pilot that lowers the buyer's perceived risk of starting, run one cohort test with one variable, and re-measure at 12 months once renewal and usage behavior exists.
Willingness-to-pay research is usually treated as a single methodology. The operators who extract revenue from it run multi-instrument programs matched to the channel and to the decision. This guide walks through the four-channel program Antler & Forge Beverage ran across DTC, specialty retail, restaurant wholesale, and duty-free, then folds in the B2B software variant: the evidence already in your CRM, why stated preference misleads in both directions, what to do in a category with no benchmark, and how findings become list price, discount floor, and tiers.
How relevant and useful is this article for you?
About the Author(s)
 Emily Ellis is the Founder of FintastIQ. Emily has 20 years of experience leading pricing, value creation, and commercial transformation initiatives for PE portfolio companies and high-growth businesses. She has previous experience as a leader at McKinsey and BCG and is the Founder of FintastIQ and the Growth Operating System.
Further reading
- Thomas Nagle & Georg Müller. The Strategy and Tactics of Pricing. Routledge, 2016
- Jagmohan Raju & John Zhang. Smart Pricing. Wharton School Publishing, 2010
- Hermann Simon. Confessions of the Pricing Man. Springer, 2015
- Robert J. Dolan. How Do You Know When the Price Is Right?. Harvard Business Review, 1995
- Rafi Mohammed. The Good-Better-Best Approach to Pricing. Harvard Business Review, 2018