
Why Blended ACV Lies to a $96M Hybrid-Revenue CRO
Blended SaaS benchmarks quietly mislead any company earning revenue from more than one motion. This guide reconstructs the KPI stack for hybrid businesses by showing which metrics to abandon, which to adopt, and how to build a peer set that reflects your economics. It uses Thornfield & Lane Analytics as the running example throughout.
The Operator's Guide to Commercial Benchmarks Across Hybrid Revenue Models
Most commercial benchmark libraries were built for companies that earn revenue one way. Real operators run companies that earn it three or four ways at once, and the averages quietly distort every board slide they produce. This guide is for the second group.
The Hook
A CRO named Constance runs commercial at Thornfield & Lane Analytics, a 220-person decision-analytics platform selling into healthcare payers, life sciences companies, and hospital systems. Thornfield & Lane is a $96M business split roughly 40/30/30 across software subscriptions, implementation and advisory services, and data licensing. For eighteen months Constance was told by her board that her ACV was low, her CAC payback was long, and her pipeline velocity was slow. Every one of those comparisons was borrowed from a pure-play SaaS benchmark set. None of them described the company she runs. The turning point was not a better dashboard. It was the decision to stop measuring three things and start measuring three different things.
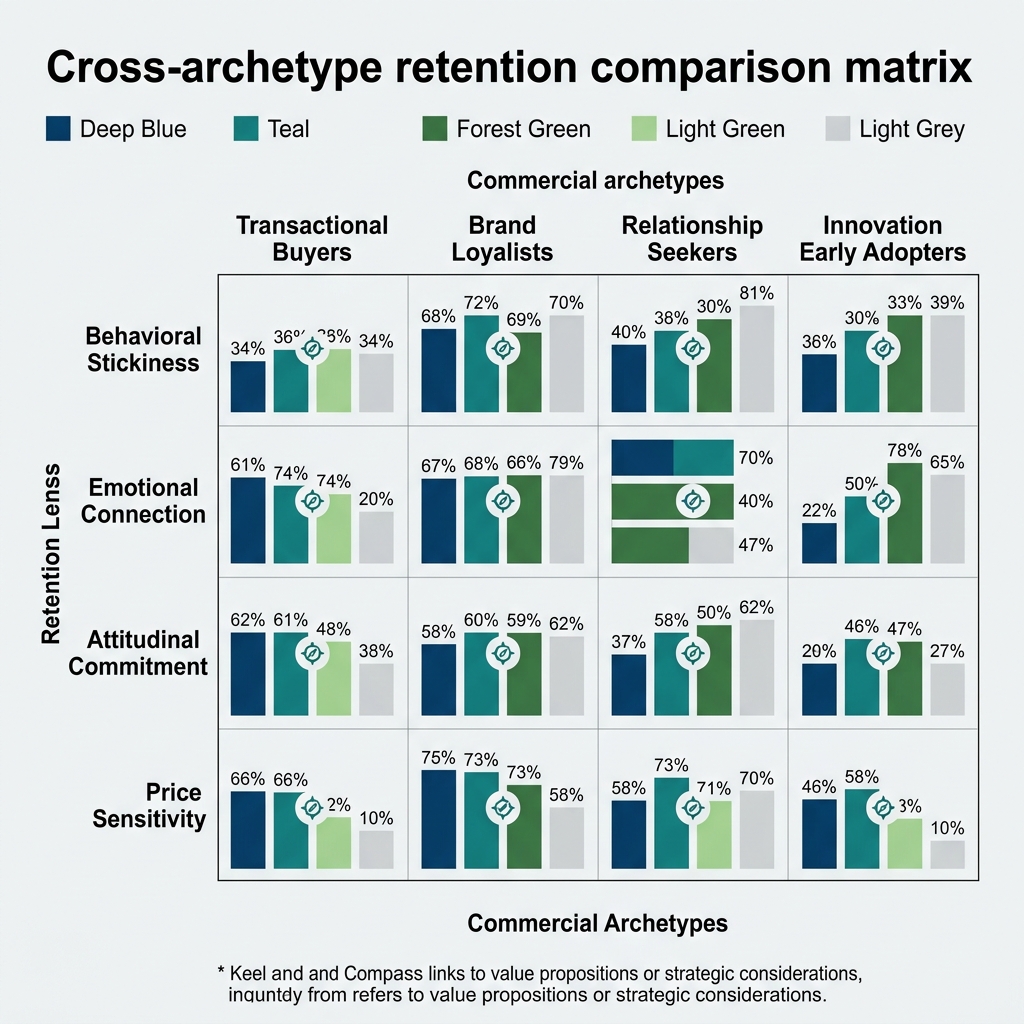 Exhibit: Cross-archetype retention comparison matrix
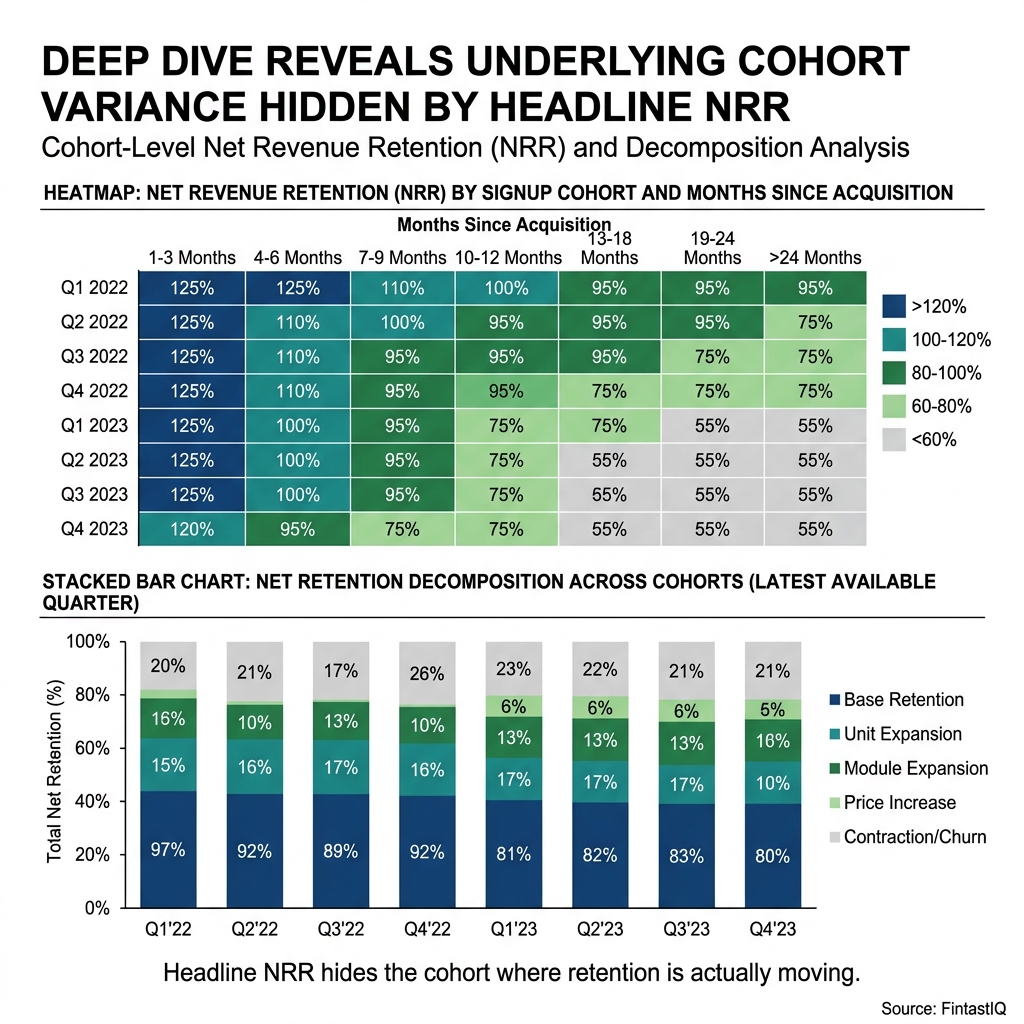 Exhibit: Cohort retention heatmap and decomposition
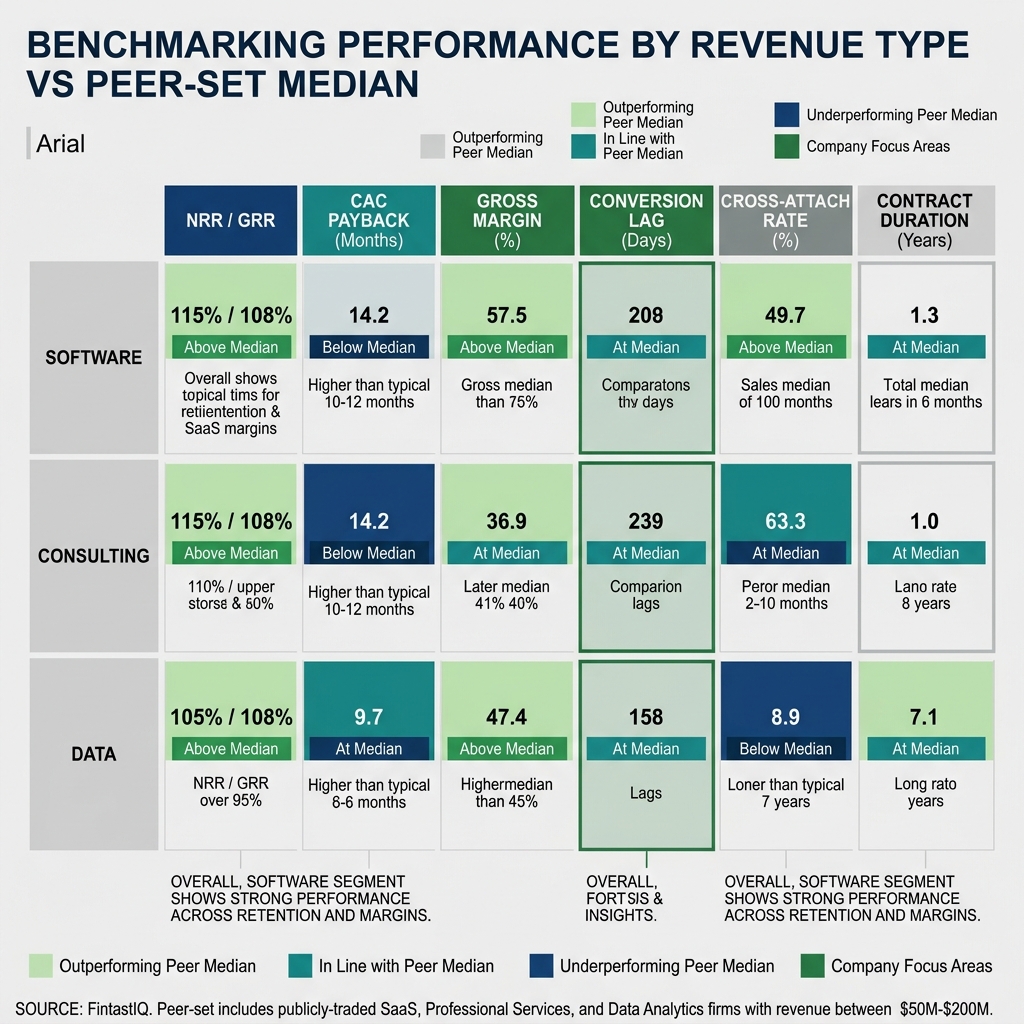 Exhibit: By-revenue-type KPI matrix
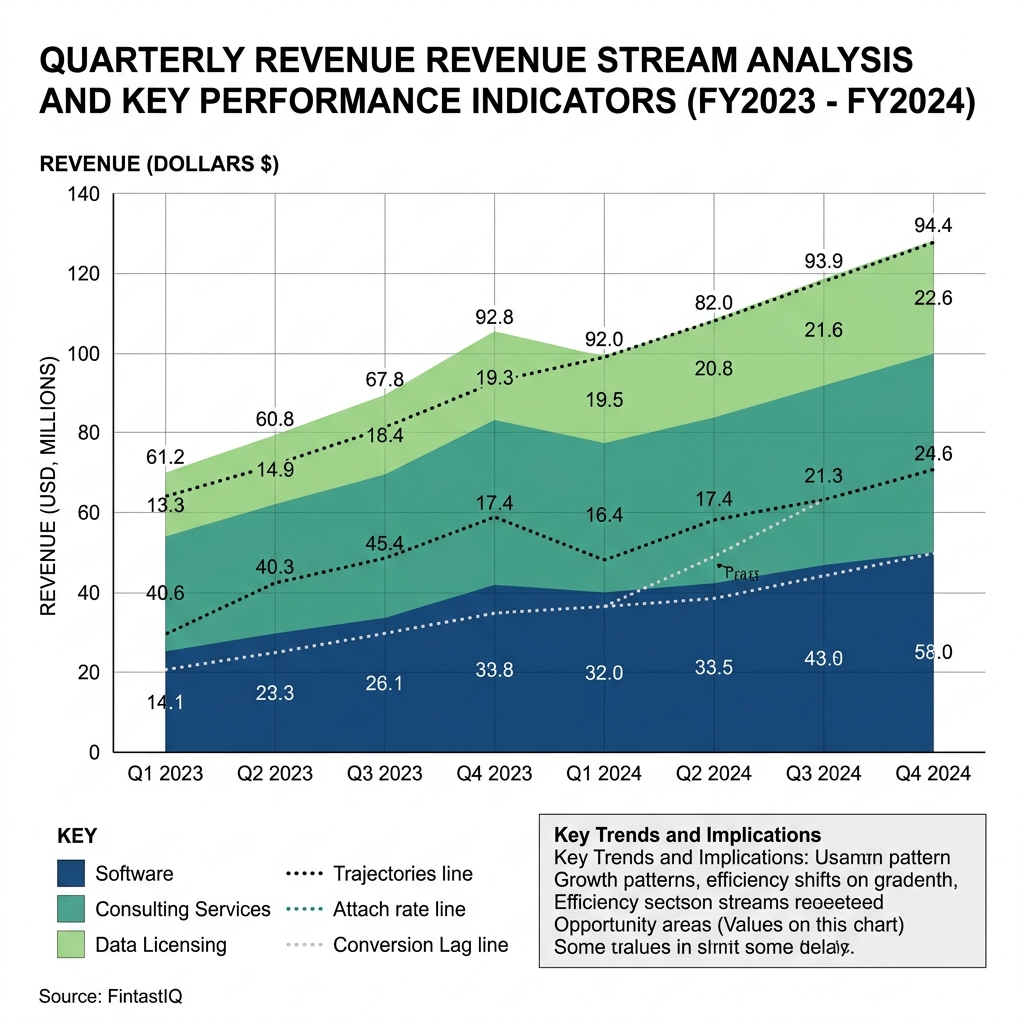 Exhibit: Revenue-mix trajectory ribbon chart
TL;DR
The best operators compete on discipline, not instinct, and discipline requires metrics that correspond to the shape of the business. For hybrid-revenue companies like Thornfield & Lane, blended averages are noise dressed as signal. This guide argues that pricing maturity is measured by what you stop doing, then lays out the exact KPI swaps a CRO should make when software, services, and data licensing coexist under one P&L. It ends with a 30-60-90 adoption sprint and two NotebookLM-ready exhibits.
The Core Problem: When Benchmarks Describe Someone Else's Company
Thornfield & Lane has 38 payer customers, 24 life-sciences customers, and 140 hospital systems on active contracts. Average contract length is three years. The commercial team is small and deliberate: six quota-carrying sellers supported by eighteen consultants who act as both delivery muscle and expansion engine. This is not a pure SaaS company. It is not a pure services shop. It is not a data broker. It is all three at once, and the interaction effects across the three motions are the business.
Constance inherited a commercial operating cadence built for only one of those motions. Her predecessor had imported a set of benchmarks from a 2021 OpenView report and an a16z deck on efficient growth. Those benchmarks assumed a single contract type, a single buyer, and a single economic engine. When applied to Thornfield & Lane, they produced three specific pathologies. Blended ACV suggested the company was underpricing, because services deals pulled the average down. Blended CAC payback suggested the sales team was inefficient, because services customers carry a fundamentally different cost-to-acquire profile. Pipeline velocity suggested deals were stuck, because consulting engagements average 210 days from first meeting to signed statement of work and the dashboard treated that as a problem to solve rather than a feature of the motion.
Pricing is a signal before it is a number, and the signals those dashboards were sending were all wrong. Constance was being asked to optimize a machine the dashboard could not see.
Part A: Why Blended Benchmarks Mislead Hybrid-Revenue Companies
A blended metric is a weighted average across revenue types that do not behave alike. The arithmetic is legal. The interpretation is not. When Thornfield & Lane reported a blended ACV of $340K, it hid the fact that the software-only median was $210K, the software-plus-services median was $610K, and the data-licensing median was $180K with a 96% gross retention rate that no pure software product in the category could match. Reporting one number erased three different businesses.
The problem compounds when benchmarks move across companies. A peer analytics firm with an 80/15/5 software-services-data mix will post different blended numbers than Thornfield & Lane, even if the underlying motions are performing identically on a unit basis. Comparing the two blends is comparing the shape of the revenue pie, not the quality of the commercial engine. Constance learned to distrust any benchmark that did not carry a revenue-mix footnote.
Three failure modes show up repeatedly in hybrid businesses that rely on blended benchmarks. The first is benchmark-envy, where an operator chases a number produced by a company with a completely different cost structure. The second is the median-trap, where the middle of a distribution is treated as a target even though the distribution is bimodal. The third is the single-peer-set fallacy, where one reference group is used to judge every motion inside the company. Thornfield & Lane had fallen into all three.
Part B: Revenue-Mix-Specific KPIs That Describe the Business
Confusion is the enemy of willingness to pay, and confusion inside the commercial cadence shows up as mispriced deals, mis-scoped services work, and underclaimed data value. The remedy is to decompose the KPI stack by revenue type and then re-aggregate only where aggregation is honest.
For the software line, Constance now tracks net revenue retention by customer segment, with the three segments being payers, life-sciences, and hospital systems. The software NRR across the book is 124%, driven largely by payer expansion on claims-analytics modules. That figure is not impressive in isolation until it is paired with gross retention, which separates expansion from churn and protects her from the classic trap of high NRR masking a leaky bucket.
For the services line, she replaced gross margin with net-contribution margin after accounting for the software revenue those engagements pull through. The headline services gross margin is an unspectacular 34%, but that number looks different when she credits services with the software ARR it originates. Against a typical benchmark of 22% for standalone consulting shops, a contribution-adjusted 34% is an outlier in the right direction. Services is not a cost center at Thornfield & Lane. It is a capitalized distribution channel.
For the data-licensing line, gross retention at 96% is the only number that matters in the first two years of a contract. Net retention comes from usage-tier upgrades and new data-set attach, and Constance reports those as a separate expansion metric rather than mixing them into the software NRR line.
The critical cross-motion metric she added is the three-product-attach rate, measured as the percentage of customers on software-only at month zero who reach all three revenue types within eighteen months. That number is 41% at Thornfield & Lane, which peer firms confirm is near the top of the distribution among the eight comparable analytics companies she benchmarks against. Cross-sell from software-only to three-product in eighteen months is the single best leading indicator of long-term account value in the business.
The second cross-motion metric is services-to-software conversion lag, the number of days between a services engagement reaching the halfway milestone and the customer signing a software expansion order. A short lag means the services team is genuinely creating commercial pull. A long or missing lag means services is being delivered in a vacuum.
The third is revenue-mix trajectory, plotted quarter over quarter and shown as a three-ribbon chart. This is the exhibit that finally reframed Constance's board conversation, because it showed at a glance that the 40/30/30 mix was stable by design, not by accident.
Part C: Benchmarks You Stop Reporting
Pricing maturity is measured by what you stop doing, and Constance stopped reporting three metrics at Thornfield & Lane the day she took over the operating review. Each was honest arithmetic that produced dishonest decisions.
Blended ACV was the first to go. It averaged across revenue types that carry different pricing logic, different buyer psychology, and different contract shapes. Publishing it forced sellers to optimize for a number that bore no relationship to the actual economics of the deal in front of them. She replaced it with segment-specific ACV by revenue type, reported as three separate figures that are never summed.
Blended CAC payback was the second. Services CAC behaves differently than software CAC, because much of the acquisition cost for services comes from expansion conversations inside existing accounts rather than new-logo pursuit. Averaging those together made the software motion look sluggish and made the services motion look efficient, which was the opposite of the truth when measured independently. She now reports software-only CAC payback, services-only CAC payback with an expansion-origin carve-out, and data-licensing CAC payback as three distinct lines.
Pipeline velocity was the third. When consulting deals take 210 days and software renewals close in 35, the blended velocity number is meaningless. She replaced it with motion-specific cycle-time distributions, reported as medians and ninetieth-percentile tails, so that deal desk conversations can focus on the right tail of each motion instead of a phantom average.
Part D: Benchmarks You Start Reporting
The replacement metrics are the three already introduced above: revenue-mix trajectory, three-product-attach rate, and services-to-software conversion lag. All three are motion-aware. All three are leading indicators. All three survive scrutiny from a board that wants to see the shape of the business, not a flattened silhouette.
Constance calibrated each against a peer set of eight analytics firms and supplemented those with published Bain and OpenView reports. Peer benchmarking matters more than industry benchmarking for hybrid businesses, because industry benchmarks average across revenue mixes while peer benchmarking can hold revenue mix roughly constant. She refreshes the peer comparison twice a year and documents the revenue-mix footnote for each comparator, so that the numbers are legible six months later when a new board member asks where they came from.
The 30-60-90 Adoption Sprint
An operator reading this guide and running a hybrid business can migrate their cadence inside a quarter if they are disciplined.
In the first thirty days, decompose every blended commercial metric in the current board book into its revenue-type components. Do not add anything new yet. The goal is to expose the distribution that the average was hiding. Constance discovered during this step that her services gross margin was being dragged down by two unprofitable engagements that predated her tenure and should never have been signed.
In the next thirty days, retire the three blended metrics and introduce segment-specific replacements. Rebuild the forecast model around motion-specific cycle times and motion-specific CAC payback, and reissue the prior four quarters on the new basis so that the board has a consistent trend line.
In the final thirty days, introduce the three cross-motion metrics. Wire the three-product-attach rate into the CRM, define the services-to-software conversion-lag event in the data layer, and publish the revenue-mix trajectory ribbon chart as a standing slide in every QBR. The last step is the hardest, because it requires the revenue operations team, the finance team, and the delivery team to agree on a single definition of each event. Thornfield & Lane took forty-five days to land this step, not thirty.
What We Do not Share Publicly
There are three Thornfield & Lane numbers that Constance reviews internally and never publishes. The first is the quota-to-consultant ratio, because it reveals the cost structure of the services motion in a way that competitors could easily exploit. The second is the internal dispersion of the three-product-attach rate, which varies widely by the seller-plus-consultant pair that originated the account and exposes the identity of the top performers. The third is the revenue-per-payer-employee metric, which is the single clearest indicator of the pricing ceiling in the payer segment and would compress pricing power if it circulated. Benchmarks have gravity, and the gravity of an unpublished benchmark is inside the company, where it belongs.
Exhibit One: By-Revenue-Type KPI Matrix (NotebookLM-ready)
Rows: software subscriptions, implementation and advisory services, data licensing. Columns: segment-specific ACV, gross retention, net retention, CAC payback, gross margin, net-contribution margin, cycle-time median, cycle-time p90, expansion-origin share. Each cell is populated with Thornfield & Lane's trailing four-quarter figure, the peer-set median from the eight comparable analytics firms, and the published Bain or OpenView reference where one exists. Cells with no honest comparator are explicitly marked "no peer" rather than filled with a blended proxy.
Exhibit Two: Revenue-Mix Trajectory Ribbon Chart (NotebookLM-ready)
X-axis: trailing twelve quarters. Y-axis: percent of total revenue, stacked to 100%. Three ribbons: software, services, data licensing. Overlay: a dotted line at the 40/30/30 target. Annotations: three events marked on the timeline that materially bent the ribbon, including the cross-sell push that moved the three-product-attach rate from 28% to 41% over six quarters. The chart is designed so that a board member can read the shape and the discipline of the company in under fifteen seconds.
FAQ
Q1: What is the single most misleading benchmark in a hybrid-revenue business? Blended ACV. It averages across revenue types with different pricing logic and creates pressure on sellers to chase a number that does not describe any real deal. At Thornfield & Lane, the blended ACV of $340K hid three distinct medians that told three different stories about pricing power. Decompose it before you do anything else, because every downstream forecast and every downstream incentive structure inherits the distortion. Replace it with segment-specific ACV by revenue type, and never sum the three figures into a single headline number on a board slide.
Q2: How should a CRO think about CAC payback when services and software coexist? They behave differently and must be measured separately. Services CAC often originates inside existing accounts through expansion conversations, while software new-logo CAC is a fundamentally different cost. Blending them makes the software motion look sluggish and the services motion look efficient, which inverts reality. Report software-only CAC payback, services CAC payback with an expansion-origin carve-out, and data-licensing CAC payback as three independent lines, and only compare each line to peers with similar revenue mix.
Q3: Why is three-product-attach rate the right leading indicator? It captures whether the commercial engine is compounding or landing logos. At Thornfield & Lane, customers who reach all three revenue types within eighteen months retain at materially higher rates, expand faster, and generate the services-to-software pull that defines the business. A 41% three-product-attach rate puts the company near the top of its peer set and directly predicts the following year's net revenue retention on the software line. No blended metric will surface this signal, because blending hides the cross-motion behavior that creates the value.
Q4: How do you choose a peer set when your revenue mix is unusual? Start from the mix, not the industry. Thornfield & Lane's eight-firm peer set was chosen because each comparator has at least twenty percent of revenue in each of two of its three motions, not because they all serve healthcare. Peer benchmarking respects the interaction effects across motions in a way that industry benchmarking cannot. Document the revenue-mix footnote for every comparator so that the peer set is legible to a board member six months later, and refresh the set twice a year.
Q5: What is the role of gross retention when net retention is strong? Gross retention is the first line of defense against a leaky bucket hiding inside a high NRR figure. A 124% software NRR can coexist with a 92% gross retention if expansion is outrunning churn, but that is not the same company as one running 124% NRR on 98% gross retention. Report both. At Thornfield & Lane, the data-licensing gross retention of 96% is the single most important number in the first two years of a contract, because expansion on that line is slower and churn-protection is paramount.
Q6: Should services be measured as a profit center or a distribution channel? Both, reported separately. Services gross margin at Thornfield & Lane is 34%, which looks ordinary against peer consulting shops at 22% and uninspiring against pure-software benchmarks. But once services is credited with the software ARR it originates, the contribution-adjusted economics are outlier-good. Report the raw services margin for P&L discipline, and report a separate contribution metric that attributes downstream software pull-through so that the board understands why the services line exists.
Q7: How long does it take to fully migrate a board book to motion-specific metrics? A disciplined CRO can do it in a quarter. Thornfield & Lane's migration took roughly 105 days. The first thirty days are pure decomposition of existing blended metrics. The next thirty are replacement of the three worst offenders with segment-specific substitutes. The final forty-five days are the hardest, because they require revenue operations, finance, and delivery to agree on shared event definitions for the cross-motion metrics. Do not skip the last step. It is the one that produces durable discipline instead of a one-quarter reporting refresh.
Q8: What benchmarks should you deliberately not publish externally? Any metric that would compress future pricing power or expose the identity of top performers. At Thornfield & Lane, the quota-to-consultant ratio, the internal dispersion of three-product-attach, and revenue-per-payer-employee are all reviewed internally and never leave the building. Benchmarks have gravity, and unpublished benchmarks keep their gravity inside the company where it can still influence decisions without arming competitors. Publish the headline revenue mix and the retention figures. Keep the mechanics of how they are produced to yourself.
Run the free assessment or book a consultation to apply this framework to your specific situation.
Questions, answered
3 QuestionsWhat's the most misleading benchmark for a hybrid software-services-data business?
Blended ACV. It averages across revenue types with different pricing logic and creates pressure on sellers to chase a number that does not describe any real deal. Decompose it before anything else: replace it with segment-specific ACV by revenue type, and never sum the three figures into a single headline number on a board slide.
How should a CRO measure CAC payback when services and software revenue coexist?
They behave differently and must be measured separately. Services CAC often originates inside existing accounts through expansion conversations, while software new-logo CAC is a fundamentally different cost. Blending them makes the software motion look sluggish and the services motion look efficient, which inverts reality.
Why is three-product attach the leading indicator for hybrid-revenue compounding?
It captures whether the commercial engine is compounding or landing logos. Customers who reach all three revenue types within eighteen months retain at materially higher rates, expand faster, and generate the services-to-software pull that defines the business. No blended metric surfaces this signal.
Blended SaaS benchmarks quietly mislead any company earning revenue from more than one motion. This guide reconstructs the KPI stack for hybrid businesses by showing which metrics to abandon, which to adopt, and how to build a peer set that reflects your economics. It uses Thornfield & Lane Analytics as the running example throughout.
How relevant and useful is this article for you?
About the Author(s)
 Emily Ellis is the Founder of FintastIQ. Emily has 20 years of experience leading pricing, value creation, and commercial transformation initiatives for PE portfolio companies and high-growth businesses. She has previous experience as a leader at McKinsey and BCG and is the Founder of FintastIQ and the Growth Operating System.
References
- Aaron Ross & Jason Lemkin. From Impossible to Inevitable. Wiley, 2016
- Rob Walling. The SaaS Playbook. SaaS Academy, 2023
- OpenView Partners. SaaS Benchmarks Report. OpenView Partners, 2023
- Bessemer Venture Partners. State of the Cloud. Bessemer Venture Partners, 2024
- McKinsey & Company. Grow Fast or Die Slow. McKinsey Quarterly, 2014