
$27M Off the Ask: 7 Diligence Findings on a $315M Welding Deal
Commercial diligence checklists collapse when they are ported from pure-SaaS targets into hybrid businesses that mix hardware, consumables, and service-contract revenue. This guide walks through a 60-item checklist architecture, the seven surfacing moves that changed a mid-market bid by tens of millions of dollars, and the post-close imperatives that decide whether the thesis lands. It is written for the operator who has to defend the number in IC, not the analyst who built the model.
The Operator's Guide to Commercial Diligence Checklists for Hybrid Targets
Most commercial diligence checklists in circulation were written for pure-SaaS targets by firms whose muscle memory is ARR, NRR, and magic number. When those checklists get pointed at a hybrid target, one that mixes hardware, consumables, and service-contract subscription, they do not underperform. They actively mislead, because the pattern recognition that works on a subscription software business hides the specific risks that live inside an installed base, a consumables pull-through rate, and a distributor channel. The checklist does not fail by being wrong. It fails by being right about the wrong business.
TL;DR
A templated SaaS diligence checklist, applied to a hybrid hardware-consumables-service target, will miss the economics that matter. This guide walks through the 60-item, six-section checklist architecture we ran on Auroboros Welding for Stag & Marrow Capital, the seven items that surfaced material risk nobody had priced, and the translation from checklist findings into bid delta and 100-day imperatives. The deal closed at $288M against a $315M ask because of what the checklist caught, and the thesis survived the first year because of what it told the operator to do on day one.
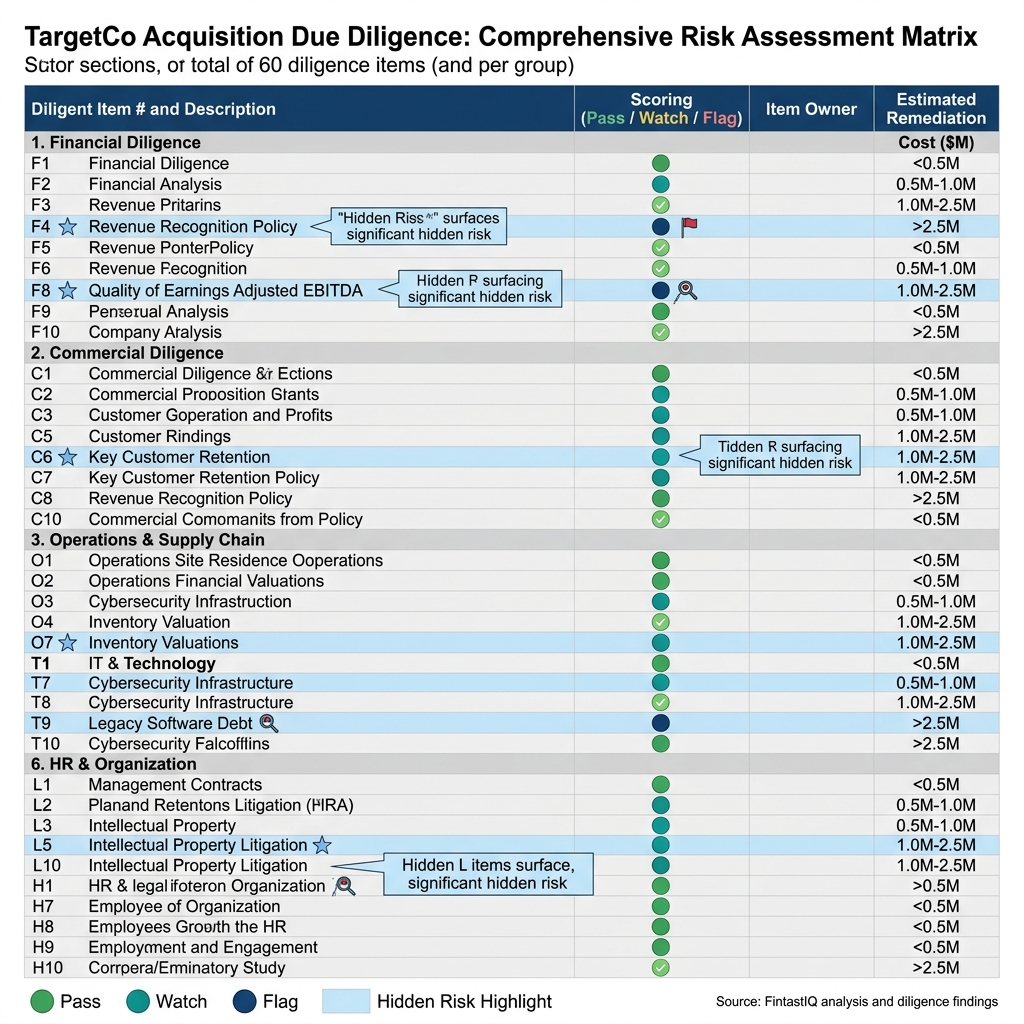 Exhibit: 60-item checklist matrix with pass/flag scoring
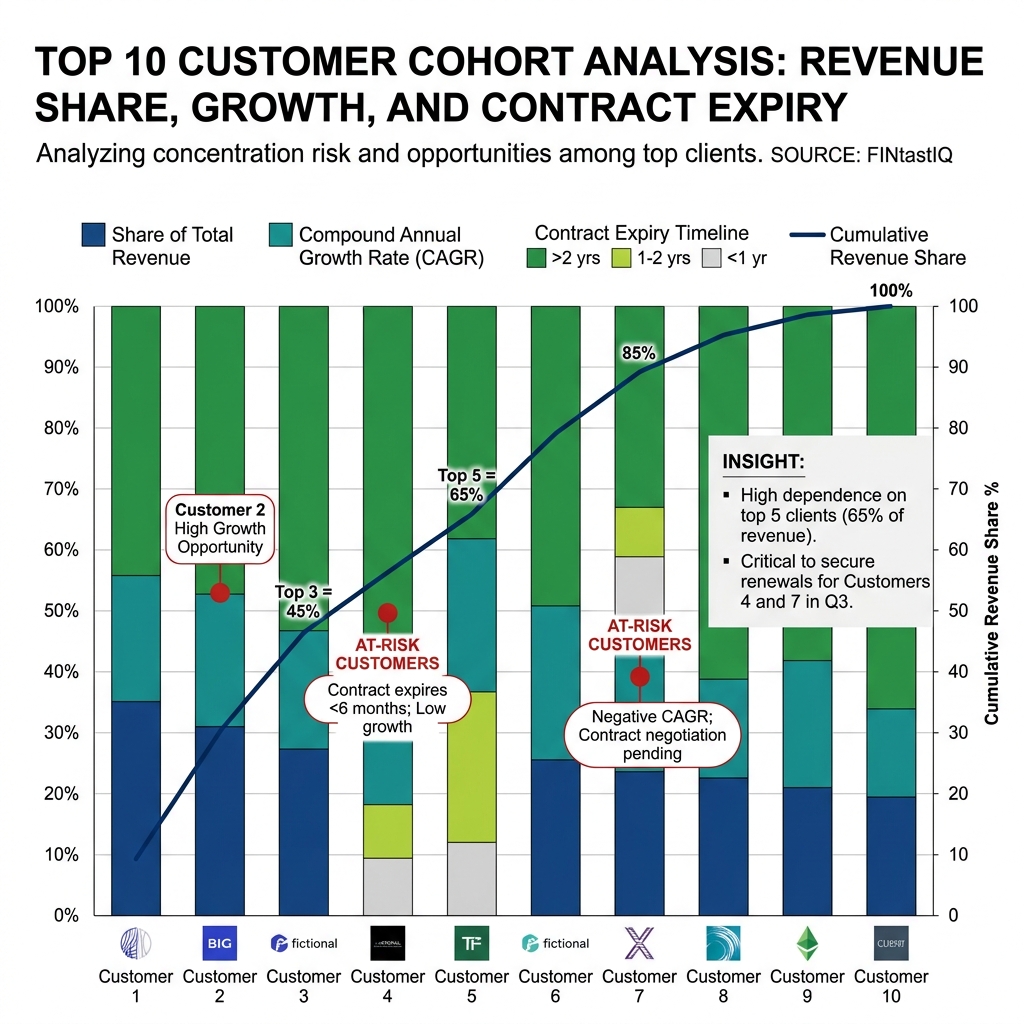 Exhibit: Top-10 customer concentration cohort chart
The core problem: why a $820M fund bought a welding robotics business with a checklist
Stag & Marrow Capital is an $820M AUM mid-market PE firm with a concentrated portfolio and a house preference for industrial businesses where subscription revenue is bolted onto a physical installed base. They brought in Remy as the operating partner on Auroboros Welding, a 280-person industrial welding robotics business doing $210M in revenue, split 52% hardware, 28% consumables, and 20% service-contract subscription. Auroboros has 1,400 robots deployed across 620 industrial accounts in aerospace, automotive, and heavy-equipment, on three-year service contracts with 84% renewal. EBITDA is $12M, which sounds thin until you understand that the mix is the thesis: the hardware sells the relationship, the consumables pay the bills, and the service contract compounds both.
Seller asked $315M. The bank book led with renewal rate and hardware backlog. The management presentation leaned on aerospace logos and a software roadmap. A pure-SaaS checklist would have graded the business on NRR, CAC payback, and pipeline coverage, concluded the business was sound, and priced it somewhere between $295M and $310M. That is roughly where the two other bidders landed.
Stag & Marrow closed at $288M, and the $27M gap between ask and close was not negotiation theatre. It was seven specific findings from a checklist built for the archetype.
Part 1: Why templated checklists fail hybrid targets
A commercial diligence checklist is a compression artifact. It takes a body of pattern recognition and encodes it into a sequence of questions the deal team can run in parallel. When the archetype the checklist was built for matches the target, compression works. The questions line up with the risks, and the answers translate cleanly into bid adjustments. When the archetype does not match, the checklist still produces answers, but the answers are load-bearing fiction. Everyone walks out of IC feeling informed. Nobody is.
The pure-SaaS checklist fails on hybrid targets in three specific ways. First, it overweights recurring-revenue quality metrics (NRR, gross retention, logo churn) and underweights the physics of the installed base. A welding robot is not a seat license. It wears out, it gets retrofitted, it generates consumables demand that has almost nothing to do with the service-contract line. Second, it has no native vocabulary for pull-through economics, grandfathered pricing cohorts, or distributor dependency, so the analyst either skips those items or forces them into fields that distort the read. Third, it treats the go-to-market engine as a sales-and-marketing question, when in a hybrid business the GTM motion is usually a three-legged stool of direct reps, channel, and field-service technicians who are functionally a renewal sales force nobody put on the org chart.
Pricing is a signal before it is a number. A checklist that asks "what is your list price" and stops there will miss the fact that 23% of Auroboros's installed base was still on 2019 service-contract pricing because nobody had the operational discipline to move them. That is not a pricing question. It is a governance question wearing a pricing costume, and the checklist has to be built to catch it.
Part 2: The 60-item checklist architecture
The checklist we ran on Auroboros has 60 items grouped into six sections, each with its own scoring convention and its own pass/flag threshold. The architecture matters more than any individual item. The point is not to ask 60 questions, it is to force the deal team to cover six distinct risk surfaces with enough granularity that nothing hides between them.
Section 1: Market and competitive (9 items). TAM definition and its sensitivity to end-market cyclicality, competitive set by segment and by deal size, win-rate trend over the last eight quarters, displacement dynamics (who are they taking share from and who is taking share from them), substitute-threat analysis, regulatory exposure, and the two questions most checklists skip: what does the target's sales team say they lose deals on, and what does the target's win/loss data show. The gap between those two answers is almost always where the competitive story breaks.
Section 2: Customer concentration and cohort health (11 items). Top-10 and top-25 revenue concentration, segment concentration, geography concentration, cohort retention curves by acquisition year, cohort expansion curves, logo churn by cohort, revenue churn by cohort, downsell rate, reactivation rate, and two diagnostic items: which cohort is the most profitable on a fully-loaded basis, and which cohort has the best renewal behavior. Those two are rarely the same cohort, and the spread tells you whether the business is harvesting or building.
Section 3: Product-revenue architecture (8 items). Revenue by line item, gross margin by line item, attach rate between lines, pull-through economics from the anchor product to the recurring lines, unit economics of each SKU family, roadmap dependency on any single product line, and the two items that matter most for hybrid targets: what percentage of service-contract revenue is grandfathered at below-current pricing, and what is the consumables-to-hardware revenue ratio by cohort year.
Section 4: Go-to-market engine (12 items). Rep productivity distribution (not average, distribution), ramp time, quota attainment by tenure, pipeline coverage by stage, conversion rates by stage, CAC by channel, CAC payback by segment, channel mix economics, distributor and partner dependency, field-service-to-renewal handoff mechanics, marketing-sourced pipeline share, and the quiet killer: what percentage of new logos in the last twelve months came from inbound versus outbound versus channel versus field-technician referral. A business that looks like it has a sales engine but is running on technician referrals is a business whose GTM cost structure is mispriced in the model.
Section 5: Pricing and discount discipline (11 items). List-price architecture, discount-band policy, discount-approval workflow, actual discount distribution versus policy, discount drift over time, price-increase history and realization rate, contract-term discipline, renewal-pricing behavior, grandfathering exposure, price-volume elasticity by segment, and the audit-trail question: can the company produce a clean, single-system view of every discount approved in the last 24 months, by deal, by approver, by reason code. If the answer is "we'd have to pull that from four systems," the finding is already in hand.
Section 6: Team and commercial-leader gaps (9 items). CRO and CCO tenure, sales-leader bench, sales-ops maturity, revenue-operations tooling, compensation-plan alignment with thesis, hiring plan versus attainment plan, attrition by role, leadership-team NPS from the field, and the seat-by-seat question: if we close this deal, which three seats need to change in the first 180 days, and has the target quietly acknowledged that.
Discounting is usually a symptom. A business with a pricing-and-discount section that scores clean almost never has a commercial-leader section that scores messy, because the same discipline that controls discounting controls hiring, compensation, and forecast accuracy. When those two sections disagree, one of them is lying.
Part 3: The seven surfacing moves on Auroboros
The full 60-item checklist produced a complete read. Seven items did the heavy lifting on bid math.
1. Consumables pull-through rate: 94%. Every deployed robot consumed Auroboros-branded wire and tips at 94% of theoretical capacity. This is exceptional. The industry benchmark is closer to 70%, because customers routinely substitute third-party consumables once the warranty lapses. 94% meant Auroboros had either a proprietary consumables moat or a service-contract structure that enforced it. The checklist item passed. The diligence team then had to decide whether 94% was durable. It was, because the service contract voided on third-party consumables, and customers had modeled that into their downtime budgets.
2. Installed-base grandfathering: 23% still on 2019 pricing. Flagged. Auroboros had raised service-contract pricing twice since 2019 but had grandfathered renewals on a rolling basis whenever a customer pushed back. 23% of the installed base (roughly 320 robots across 140 accounts) was still paying 2019 rates. That was a $4.1M annual revenue gap against current pricing. More importantly, it was a governance signal. The company had no mechanism to end grandfathering.
3. Top-10 customer concentration: 38% of revenue. Acceptable. In industrial welding robotics, top-10 concentration at that level is normal. Aerospace and heavy-equipment are structurally concentrated end-markets. A pure-SaaS checklist would have flagged 38% as high-risk. The archetype-adjusted read was that 38% in this industry was in line, and the cohort data showed the top-10 was diversifying, not concentrating, over the last 36 months.
4. Single-distributor dependency in Europe. Flagged. One distributor handled 78% of European revenue under a contract that renewed annually and had a 90-day termination clause. European revenue was $34M. A distributor-swap event would create a 6-to-9-month revenue gap. This was not in the bank book.
5. CRO tenure: 9 months, hiring plan behind. Flagged. The CRO had joined 9 months before diligence, inherited a 14-person quota-carrying team, and was supposed to have hired three regional sales directors by month 6. Two of three were still open. Attainment was tracking to 87% of plan, which the company was presenting as healthy. The checklist read was that the CRO was not yet a known quantity, the bench was thin, and the plan-to-actual gap was going to widen before it closed.
6. Renewal-at-risk concentration in 2026: 24 accounts, approximately 18% of revenue. Flagged. Of the 620 accounts, 24 had service contracts expiring in a six-month window in 2026, and together they represented about 18% of total revenue. Four of those accounts had open service tickets older than 60 days. This is the kind of finding that lives nowhere in a standard diligence. It requires pulling the renewal calendar and cross-referencing it against the service-ticket database, which means the checklist has to ask for both and then do the join.
7. Discount-approval audit trail fragmented across 4 systems. Flagged. Salesforce held the quote, an Excel tracker held the approval, an internal pricing tool held the override, and the ERP held the invoiced price. Reconciling a single deal required touching all four. The diligence team pulled a 50-deal sample, found reconciliation gaps on 11 of them, and concluded that the company did not know its realized-versus-approved discount rate with any precision. That is a pricing-maturity finding and a systems finding simultaneously.
The best operators compete on discipline, not instinct. Six of those seven items were discipline findings, not product findings, not market findings. The checklist caught them because the checklist was built to catch them.
Part 4: Bid math translation and the 100-day imperatives
The seller asked $315M. Stag & Marrow modeled the seven findings into the bid the following way.
The grandfathering finding was a $4.1M annual revenue gap that, once reset, flowed to EBITDA at roughly 80% margin. At the close multiple, that was worth approximately $11M of enterprise value, but only if the reset happened, and the diligence read was that it would require an operator-led intervention, not a management-led one. Stag & Marrow priced the grandfathering finding at $7M of bid reduction, reflecting the execution risk.
The European distributor finding was priced as a scenario-weighted deduction: 35% probability of a distributor-swap event in the hold period, 6-to-9-month revenue gap, roughly $14M of gross-profit-at-risk, priced as $5M of bid reduction plus a covenant on the distributor contract.
The CRO and hiring-plan finding was priced as a year-one attainment haircut. Stag & Marrow modeled 82% attainment against plan for year one, down from management's 97%, which compounded through the model as approximately $8M of bid reduction.
The renewal-at-risk concentration was priced as a $3M bid reduction reflecting two-account loss probability, with a covenant requiring a renewal playbook to be in place before close.
The remaining findings (audit trail, installed-base read, pull-through durability) were priced collectively as $4M of bid reduction, reflecting the operational lift required in the first year.
Total bid reduction from ask: $27M. Opening bid: $268M. Closed: $288M after negotiation, with two covenants (the distributor contract renegotiation commitment and the renewal-playbook milestone) surviving into the purchase agreement.
Post-close 100-day imperatives:
Imperative one: service-contract floor-price reset. Move the 23% grandfathered installed base onto current pricing by the end of the first year, with a phased approach: the smallest accounts first, then the mid-tier, then a direct operator-to-decision-maker conversation with the top-20 grandfathered accounts. Expected revenue recovery: $3.4M in year one, $4.1M annualized by month 14.
Imperative two: European distributor renegotiation. Open a parallel-path conversation with a second European distributor inside the first 60 days, restructure the primary relationship with a three-year term and exclusivity carve-outs for aerospace accounts, and build a direct-sales contingency plan for the top-five European accounts. The goal is not to swap the distributor. The goal is to make the swap optional.
Pricing maturity is measured by what you stop doing. In the first 100 days, the operator's job is not to add. It is to stop grandfathering, stop approving discounts outside policy, stop renewing the European contract on auto-pilot. The adds come in the second year.
Three failure modes to avoid
Checklist-theater. The deal team runs all 60 items, produces a beautifully formatted deck, and never translates any of the findings into bid math. The checklist becomes a ceremony. You know it is theater when the findings section and the valuation section do not reference each other by number.
Seller-narrative-capture. The target's CFO walks the deal team through the data room, and the checklist answers start inheriting the CFO's framing. The 23% grandfathering becomes "historical customer goodwill." The distributor dependency becomes "a long-standing partnership." When the checklist answers start using the seller's adjectives, the diligence is already compromised.
Checklist-without-archetype-adjustment. The firm has a pure-SaaS checklist, points it at a hybrid target, and the scoring thresholds never get recalibrated. 38% top-10 concentration gets flagged because the SaaS benchmark is 25%. Consumables pull-through never gets measured because the checklist has no field for it. The checklist produces grades. The grades are wrong, because the rubric was wrong.
The 30-60-90 sprint
Pre-LOI (day -30 to day 0). Archetype-fit assessment of the target. Customize the checklist against the archetype. Identify the 7-to-10 items most likely to be material. Pre-read the bank book and flag where the narrative is doing the work the data should be doing.
LOI to SPA (day 0 to day 60). Run all 60 items in parallel workstreams. Hold a mid-cycle IC where the findings get translated into bid math in real time, not at the end. Write the covenant list before the final bid, not after.
SPA to close (day 60 to day 90). Lock the 100-day plan against the findings. Assign each finding to a named operator with a named milestone. Brief the management team on the findings before close, not after. The ones you plan to keep working with should hear the hard reads from you directly.
Post-close (day 90 to day 190). Execute the 100-day imperatives. Reconcile the findings against first-90-day actuals. Update the thesis model. Brief the LPs.
FAQ
Q: How is a hybrid-target checklist structurally different from a SaaS checklist? A: It adds native fields for physical-installed-base economics, pull-through rates, channel and distributor dependency, and grandfathered-pricing exposure, and it recalibrates concentration and retention thresholds against the archetype. A SaaS checklist asks about NRR and CAC payback. A hybrid checklist asks about consumables pull-through by cohort year, service-contract floor-price drift, and field-technician-to-renewal handoff mechanics. The questions are different, the thresholds are different, and the bid-math translations are different.
Q: What does archetype fit mean in commercial diligence? A: It means the checklist, the benchmarks, and the scoring rubric are all built for the specific revenue architecture of the target: hardware-plus-consumables-plus-service versus pure SaaS versus marketplace versus professional services. Archetype fit is the difference between a checklist that catches the 23% grandfathering finding and a checklist that grades the company on NRR and moves on. If the firm has one checklist for all deals, the firm has no checklist.
Q: How many diligence items are material on a typical mid-market deal? A: Out of 60 items, usually 7 to 10 drive more than 90% of the bid-math adjustment. The other 50 matter because they confirm the read. They show the deal team where the business is working, where the management story holds up, and where covenants are unnecessary. On Auroboros, seven items drove the $27M gap between ask and close.
Q: Who should own the checklist: the deal team, the operating partner, or a third-party advisor? A: The operating partner owns the translation from findings to bid math and to 100-day imperatives, because only the operator will be accountable for executing the plan. The deal team runs the workstreams. The third-party advisor contributes archetype-specific benchmarks where the firm lacks them internally. The checklist itself lives with the firm, not the advisor. If it lives with the advisor, it does not survive the engagement.
Q: How does the checklist change for growth-equity versus buyout? A: Growth-equity weights Section 1 (market) and Section 4 (go-to-market engine) more heavily because the thesis is usually topline-expansion-driven. Buyout weights Sections 5 (pricing discipline) and 6 (team gaps) more heavily because the thesis is usually operational-discipline-driven. On Auroboros, the weighting was buyout-heavy. The operator's job was discipline, not expansion.
Q: What is the relationship between the checklist and the 100-day plan? A: Every flagged item in the checklist becomes either a bid-math adjustment, a covenant, a 100-day imperative, or some combination of the three. The checklist is not a separate document from the 100-day plan. It is the source document. If the 100-day plan does not trace its imperatives back to specific checklist findings, the post-close team is working from instinct, not from the diligence.
Q: How should discount-approval audit trails be evaluated in diligence? A: Pull a sample of 30-to-50 deals from the last 24 months and ask the target to reconcile quoted discount, approved discount, contracted discount, and invoiced discount for each one. The reconciliation time per deal is the finding. If the team can do it in under 10 minutes per deal, pricing governance is healthy. If it takes 45 minutes and touches four systems, the governance is broken and the realized-discount rate is not known with precision.
Q: What is the single most underused item on a commercial diligence checklist? A: Cohort-level consumables or attach-product pull-through rate, in hybrid targets. Most deal teams look at the company-level number and stop. The cohort view shows whether pull-through is decaying over time. A decaying pull-through signals that the installed-base moat is eroding, which is a thesis-breaking finding that the headline number hides. On Auroboros, the cohort view confirmed the 94% was stable. On other deals, it has killed the bid.
Run the free assessment or book a consultation to apply this framework to your specific situation.
Questions, answered
3 QuestionsWhy do standard SaaS diligence checklists fail on hybrid hardware-plus-consumables targets?
Because the pattern recognition built for ARR, NRR, and magic number hides the risks specific to an installed base, a consumables pull-through rate, and a distributor channel. The checklist does not fail by being wrong. It fails by being right about the wrong business.
Which commercial risks do PE deal teams miss most often in hybrid-revenue diligence?
Consumables pull-through concentration, service-contract renewal erosion by cohort vintage, distributor margin stacking, and pricing that tracks accounting history rather than customer value. Each of these requires a different analytical cut than a standard SaaS diligence checklist produces.
How do commercial diligence findings translate into a post-close 100-day plan?
Named commercial imperatives with owners, milestones, and metrics. A finding that installer NPS is weak becomes a 90-day imperative to reach a named threshold with a weekly scorecard. A finding that three billing dimensions track nothing customers value becomes a 60-day imperative to retire them with a contract-transition plan.
Commercial diligence checklists collapse when they are ported from pure-SaaS targets into hybrid businesses that mix hardware, consumables, and service-contract revenue. This guide walks through a 60-item checklist architecture, the seven surfacing moves that changed a mid-market bid by tens of millions of dollars, and the post-close imperatives that decide whether the thesis lands. It is written for the operator who has to defend the number in IC, not the analyst who built the model.
How relevant and useful is this article for you?
About the Author(s)
 Emily Ellis is the Founder of FintastIQ. Emily has 20 years of experience leading pricing, value creation, and commercial transformation initiatives for PE portfolio companies and high-growth businesses. She has previous experience as a leader at McKinsey and BCG and is the Founder of FintastIQ and the Growth Operating System.
References
- William Thorndike. The Outsiders. Harvard Business Review Press, 2012
- Eileen Appelbaum & Rosemary Batt. Private Equity at Work. Russell Sage Foundation, 2014
- Aaron Ross & Jason Lemkin. From Impossible to Inevitable. Wiley, 2016
- Bain & Company. Global Private Equity Report. Bain & Company, 2024
- OpenView Partners. SaaS Benchmarks Report. OpenView Partners, 2023