
Why Last-Click Attribution Is Inflating Your CAC by 20-40%
The 60/40 brand-to-performance mix is not a preference. It is the math that explains why your CAC is inflating while your pipeline is stalling. Binet and Field proved it. Your last-click dashboard hides it. This guide is the operating discipline for running a marketing portfolio that compounds across four-year horizons instead of four-week reports.
The Operator's Guide to Brand vs Performance Marketing
Your last-click attribution model says brand is a cost. Your retention data says brand is the only reason you have customers left.
Binet and Field studied hundreds of IPA case entries and landed on a ratio that every CMO quotes and almost no operator holds. 60 percent brand. 40 percent performance. It is the mix that produces the highest long-term business effect across categories, cycles, and economic conditions. The operators who ignore it do not ignore it because they disagree. They ignore it because the quarterly board deck rewards the 40 and punishes the 60.
Your marketing team built the campaign. Finance cut the budget. The CRO cut it harder. The brand line item was the first to go.
That is the common pattern. It is also the expensive one.
TL;DR.
- The 60/40 brand-to-performance split is the empirical long-term optimum for most categories. In B2B with long sales cycles it usually wants to be higher than 60 on the brand side, not lower. The split is directional but the discipline is not optional.
- Excess share of voice is the lever. When your share of voice exceeds your share of market, you gain share. When it lags, you lose share. Performance-only spend keeps share of voice flat while competitors with a brand line item pull away.
- Performance channel efficiency is a dividend of brand saturation. Starve the brand and your CAC inflates with a 6-to-12-month lag. The numbers look fine for two quarters. Then they do not.
- The attribution model you need is media mix modeling, not last-click. Last-click makes brand invisible by construction. If your measurement system cannot see brand, your budget will not fund brand.
The core problem: short-termism is a governance failure, not a marketing failure
Marketing budgets get cut the way they get cut because the board review cycle is 90 days and the brand payoff cycle is 24 months. Performance marketing reports clean. Every dollar in, a traceable dollar of pipeline out, attributed, dashboarded, defensible. Brand marketing reports messy. Dollars in, trust built, awareness accrued, category position held. None of that shows up in a last-click report because last-click was designed to measure the channel, not the conditions that make the channel work.
Meet Midwest Freight Tech. 220 people, $85M revenue, B2B logistics software sold to dispatchers at regional trucking carriers with 150-to-900-truck fleets. Sales cycle 7 to 9 months. The economic buyer is a carrier CFO. The influence map includes a VP of operations who does not trust software vendors by default. In 2024, board pressure led to a 78/22 performance-to-brand split, up from 55/45. Pipeline was soft, performance channels looked productive in the model.
Pipeline grew for two quarters. Then it stalled. CAC inflation hit 34 percent by the third quarter. Trade show conversions that used to run 18 percent now ran 11 percent, because the dispatchers at the booth had never heard of Midwest Freight Tech before walking up.
By mid-2025 the team rebalanced to 60/40. Cost-per-opportunity dropped 22 percent over the following three quarters. Trade show booth conversion climbed back to 17 percent. The product did not change. The sales team did not change. The only change was that when the dispatcher walked up to the booth, they already knew the name.
Pricing is a signal before it is a number. The same rule applies to marketing spend. Your brand budget is a signal to the market about how serious the category is, and to your performance channel about how warm the audience will be when it arrives. Cut the signal and the number stops working.
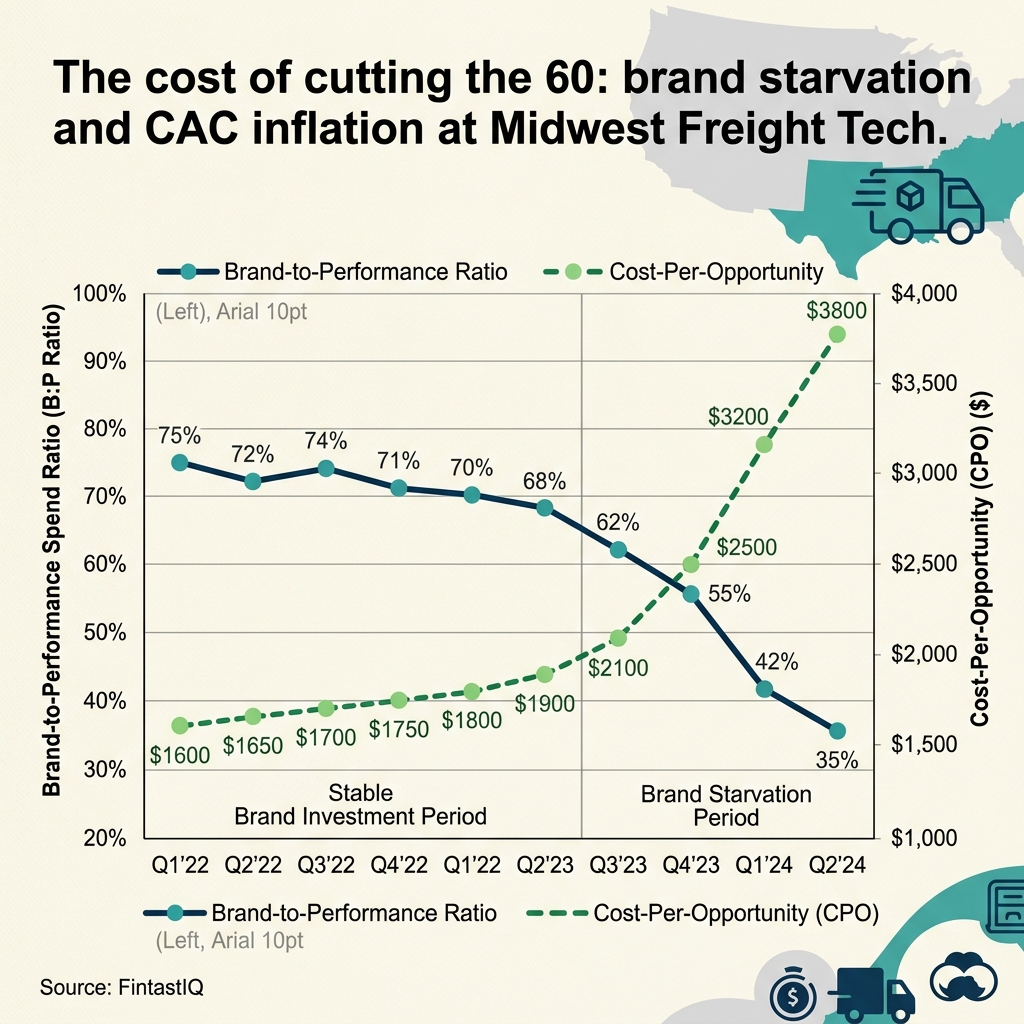 Exhibit: Brand starvation CAC curve
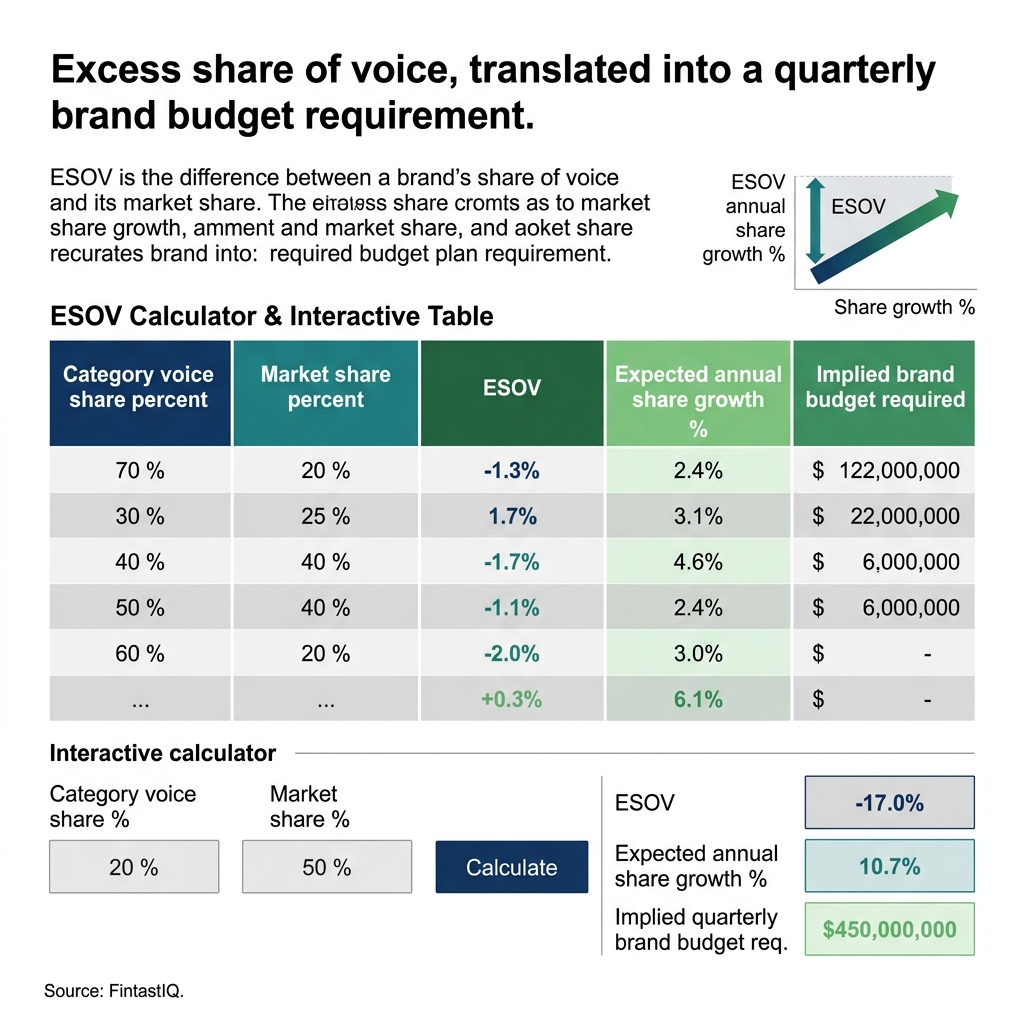 Exhibit: Excess share of voice calculator
The four-part framework
Four decisions. Each one is a governance decision more than a creative one.
Part 1: The 60/40 baseline and why it is directional, not absolute
Binet and Field's The Long and Short of It is the primary source. The 60/40 average is the result of hundreds of case studies across categories, measured over multi-year windows. The ratio is directional because the optimum shifts with cycle length, category maturity, and brand incumbency.
In B2B with a 7-to-9-month sales cycle like Midwest Freight Tech's, the practical optimum sits between 60/40 and 70/30 on the brand side. The logic is mechanical. The buyer is out of market for most of any given year. The only asset that works on them while they are out of market is memory. Brand spend during that window is the entire game.
Operators get this wrong by treating 60/40 as a rule rather than a center. The rule is: pick a ratio, hold it across two budget cycles, measure the downstream effect on cost-per-opportunity and pipeline velocity. The specific ratio is a hypothesis. Holding a ratio is the practice.
Al Ries in The 22 Immutable Laws of Marketing made the point with the Law of Perspective. A one-quarter view will always flatter performance and punish brand. The 60/40 ratio only looks right if you measure on the window where it is designed to work.
Part 2: Excess share of voice is the lever you are pulling
Share of voice is the percentage of category advertising spend you represent. Share of market is the percentage of category revenue you represent. The gap between the two, excess share of voice, is the predictor of future share growth.
Binet and Field quantified this. A 10-point ESOV gain typically produces around 0.5 points of market share growth over the following year in mature categories, more in emerging ones. The mechanism is mental availability, which Byron Sharp framed in How Brands Grow as the probability a brand comes to mind in a buying situation. You cannot be in the consideration set if you are not in the memory. You cannot be in the memory if your share of voice is below your share of market for four quarters running.
Midwest Freight Tech's ESOV story is instructive. In 2023 they were roughly 8 percent share of market in the mid-market carrier segment and spending 11 percent of identifiable category voice, a positive ESOV of 3 points. By mid-2024, after the rebalance toward performance, their share of voice had dropped to 6 percent while share of market held flat at 8. Negative ESOV of 2 points. Aided brand recall at the next trade show: 41 percent, down from 58 percent a year earlier. The pipeline impact showed up two quarters later.
Sharp's work is uncomfortable for performance-first operators because it contradicts the narrative that your buyer is rational, informed, and carefully comparing vendors. The buyer is mostly not thinking about you. When they are in market, they are thinking about the two or three names that come to mind first. If you are not one of those names, you get a meeting if you are lucky. Usually you do not.
Packaging beats pricing in pricing. Mental availability beats persuasion in marketing. The brand line item is the purchase of mental availability.
Part 3: The conversion dividend
Performance channel efficiency is a derivative of brand saturation. That is the claim, and it is measurable.
Three mechanisms. Click-through rates on branded search and retargeting run 15 to 30 percent higher when the name is familiar. Landing page conversion runs 20 to 40 percent higher in B2B considered purchases when the prospect has context. Sales cycle touch count is lower when the first touch is not a cold touch. At Midwest Freight Tech, dispatcher first meetings converted to qualified opportunity 34 percent of the time when the dispatcher had seen the brand before, 19 percent when they had not.
Multiply those mechanisms and you get what Binet and Field call the conversion dividend. A brand-saturated performance channel runs 20 to 40 percent more efficient than the same channel in a cold category. Starve the brand for two quarters and the dividend shrinks. Performance CAC rises, not because the channel got worse, but because the buyer got colder.
This is where the board conversation goes wrong. The dashboard shows CAC rising and concludes the performance team needs more budget or better creative. The fix is upstream. Fund the brand that warms the channel. The performance CAC falls on its own.
Price increases fail because of communication, not the price. The parallel in marketing is that performance channels fail because of brand starvation, not creative fatigue. Keep optimizing creative on a cold audience and you are discounting the brand you refused to fund.
Discounting is usually a symptom. Performance-only spend is discounting your future pipeline.
Part 4: The attribution model you need
Last-click attribution is a measurement system designed to credit the last channel the buyer touched before converting. It does exactly that, and nothing else. It was not designed to measure brand. Using it to measure brand is a category error.
The alternative is media mix modeling, which Binet and Field treat as the baseline standard for any portfolio running both brand and performance. Regress business outcomes against marketing inputs over time. Control for seasonality, macro, and competitor activity. Read the coefficients.
At Midwest Freight Tech's stage, a lightweight MMM is enough. Monthly data on pipeline generated, brand spend by channel, performance spend by channel, two or three control variables. Four quarters before the model gives useful coefficients. Eight before it is decision-grade. The team built theirs in late 2024 as a spreadsheet regression, and within three quarters it was explaining 68 percent of pipeline variance. Brand spend was the second-largest coefficient, behind only trade show spend. Last-click had been crediting paid search for most of that effect.
April Dunford in Obviously Awesome makes the point that positioning is the context in which your product is evaluated. The attribution question is a positioning question in disguise. If your measurement system is positioned around last-click, your budget will be positioned around performance. Change the measurement, and the budget follows.
The best operators compete on discipline, not instinct. The discipline here is using the measurement that matches the time horizon. Short-term measurement for short-term effect. Long-term measurement for long-term effect. Refusing to run the long-term measurement and then claiming the long-term effect is not real is a refusal, not a finding.
Where this framework breaks
Three failure modes. Each one costs real money.
Failure one: board-panic budget reallocation mid-year. The quarter comes in soft, the board asks for a revised plan, the CMO volunteers the brand line item as the cut because it is the one the board will not fight to defend. Two quarters later the cost-per-opportunity inflation arrives, and the team does not connect it to the cut, because the dashboards do not reach back that far. Fix: pre-commit the brand allocation at the start of the planning cycle and name it as protected budget. The defense memo references the 60/40 evidence base, names the expected lag, and commits to a measurement window before the money is spent. The conversation becomes "which quarter do we accept pipeline impact" rather than "is brand worth the money."
Failure two: brand campaigns that are performance ads with bigger fonts. You approved a brand campaign. The agency shipped a campaign. It has your logo, a tagline, and a CTA to book a demo. It is a performance ad with a brand budget. Seth Godin in This Is Marketing is clear: building an audience is different from buying attention. Brand work earns permission to be remembered. Performance work harvests intent that already exists. Fix: brief the two separately. Brand briefs include a point of view, a category argument, and a memorability test. Performance briefs include an offer, a conversion goal, and a CAC target.
Failure three: attribution theater. You installed a multi-touch attribution tool. It spreads credit across channels with a weighted model. Everyone feels better. The model is still last-click-adjacent, because the underlying data is still click data. Pipeline gets credited to the channel that generated the form fill, and the 14-month brand exposure that made the form fill happen gets credited to nothing. Fix: run MMM alongside the attribution tool for two quarters. Compare the coefficients. Use MMM for budget allocation. Use multi-touch attribution for channel optimization within an allocation. Do not confuse the two.
The 30-60-90 sprint for rebalancing the mix
Days 1 to 30. Baseline your ratio and your ESOV. Pull the last 24 months of spend. Classify every line item as brand, performance, or hybrid. Be honest about the trade show booths, the sponsorships, and the content hubs. Calculate your actual ratio, quarter by quarter. Then pull the ESOV data. Use Kantar, SimilarWeb, or share of search as a proxy if you cannot get clean category voice data. The output is a one-page artifact: current ratio, ESOV trend, cost-per-opportunity curve overlaid against both. That artifact is the conversation with the CFO and the CEO.
Days 31 to 60. Write the reallocation memo and pre-commit the measurement window. Propose the new ratio. For Midwest Freight Tech's stage, 65/35 was the recommendation. Name the lag: two to four quarters for cost-per-opportunity, four to eight for pipeline velocity. Name the kill criteria. The memo is signed by the CMO, the CRO, and the CFO, which means the CFO cannot unilaterally cut the allocation at the next quarterly review without reopening the memo. That is the governance fix.
Days 61 to 90. Instrument the measurement system and ship the first wave of brand work. Stand up the MMM, even a spreadsheet version. Ship the first brand campaign that passes the memorability test, not the demo-request test. For Midwest Freight Tech that was a trade press thought leadership series authored by their VP of ops, a podcast sponsorship in a dispatcher-focused show, and a trade show booth rebuild that replaced the badge scanner with a live demo theater. Performance spend did not go to zero. It went to 35 percent of the mix, with the freed budget reinvested against a two-to-four-quarter measurement window.
FAQ
Is the 60/40 rule a hard number or a directional guide? Directional. Binet and Field reported an average across case studies. In B2B with a 7-to-9-month cycle, the brand share usually wants to be higher than 60. Treat 60/40 as the center of the distribution, not the answer. The discipline is holding a ratio on purpose, not landing on a specific decimal.
How do I defend a brand budget to a CFO who only sees last-click attribution? Stop arguing about attribution. Start arguing about cost-per-opportunity trend. Pull the last 24 months of cost-per-opportunity and overlay brand spend. The inverse relationship is usually visible once you have two full quarters of underinvestment.
Does excess share of voice apply in B2B? Yes, and arguably harder. Long cycles and small buyer pools mean the share-of-voice premium compounds because buyers remember you across the months they are not in market. Binet and Field extended the ESOV work to B2B in the 2019 LinkedIn B2B Institute study.
What is the right split for a company below $10M in revenue? Probably closer to 40/60, brand to performance, inverted from the mature state. Moving to 60/40 too early starves the distribution engine. Staying at 40/60 too long starves the awareness that lets the distribution engine compound.
How long before the brand investment shows up in the numbers? Two to four quarters for cost-per-opportunity improvement. Four to eight quarters for pipeline velocity. Eight to twelve quarters for category share. Pre-commit the measurement windows in the planning cycle, not after the numbers come in.
Is trade show spend brand or performance? Both, depending on the booth. A booth designed to capture badge scans is performance. A booth designed to be remembered Monday morning is brand. The tell is whether anyone talks about you after the show.
What does brand do to performance channel efficiency? Raises click-through rates, raises conversion rates, lowers touch count. A brand-saturated performance channel runs 20 to 40 percent more efficient than a cold one. That efficiency premium is the conversion dividend. Starve the brand and the dividend shrinks.
Can I use media mix modeling at my stage? Yes, at $30M and above. A lightweight spreadsheet regression of pipeline against brand and performance spend, with two or three control variables, will be directionally useful by the fourth quarter of data. The point is not precision, it is escaping last-click.
Run the free assessment or book a consultation to apply this framework to your specific situation.
Questions, answered
8 QuestionsIs the Binet and Field 60/40 brand-to-performance rule a hard number or directional?
Directional. Binet and Field reported an average across hundreds of IPA case studies. The long-term optimum varies by category, stage, and buying cycle length. In B2B with a 7-to-9-month sales cycle, the brand share usually needs to be higher than 60, not lower, because the compounding window is longer. Treat 60/40 as the center of the distribution, not the answer. The discipline is holding a ratio on purpose, not landing on a specific decimal.
How do you defend a B2B brand budget to a CFO who only trusts last-click attribution?
Stop arguing about attribution. Start arguing about cost-per-opportunity trend. Brand starvation shows up as CAC inflation with a 6-to-12-month lag. Pull your cost-per-opportunity curve for the last 24 months. Overlay your brand spend. The inverse relationship is usually visible once you have two full quarters of underinvestment. That chart is the conversation. The attribution debate is unwinnable. The efficiency debate is not.
Does excess share of voice (ESOV) apply in B2B or is it just a consumer concept?
It applies in B2B, and arguably harder. In categories with long sales cycles and small buyer pools, the share-of-voice premium compounds because buyers remember you across the 7 months they are not in market. Binet and Field extended the ESOV work to B2B in the 2019 LinkedIn B2B Institute study. The mechanism is the same. The measurement window is longer.
What's the right brand-to-performance split for a company under $10M in revenue?
Probably closer to 40/60, brand to performance, inverted from the mature state. Early stage companies need cash conversion to fund the next hire. The 60/40 split earns in once you have category awareness to defend, usually around $20M to $30M in revenue. Moving to 60/40 too early starves the distribution engine. Staying at 40/60 too long starves the awareness that lets the distribution engine compound.
How long before B2B brand investment shows up in pipeline and CAC numbers?
Two to four quarters for cost-per-opportunity improvement. Four to eight quarters for pipeline velocity. Eight to twelve quarters for category share. If your board wants quarterly brand ROI, you do not have a brand problem, you have a governance problem. Set the expectation before the spend. Pre-commit the measurement windows in the planning cycle, not after the numbers come in.
Is trade show and event spend brand marketing or performance marketing?
Both, and it depends on the booth strategy. A booth designed to capture leads with a badge scanner is performance. A booth designed to be remembered after the show, with a point of view worth quoting, is brand. Most operators run performance booths and tell their board they are running brand booths. The tell is whether anyone talks about you the Monday after the show. If not, that was a lead generation line item priced as a brand line item.
What does brand investment actually do to performance channel efficiency and CAC?
Three things. It raises click-through rates on the same creative because the name is familiar. It raises conversion rates on the same landing page because the buyer has context. It lowers required touch count because the first touch is not a cold touch. A brand-saturated performance channel typically runs 20 to 40 percent more efficient than the same performance channel in a cold category. That efficiency premium is the conversion dividend. Starve the brand and the dividend shrinks, which is what inflates the CAC that the performance dashboard then tries to solve by spending more.
Can a $30M revenue company use media mix modeling, or is MMM only for billion-dollar advertisers?
You can use a lightweight version at $30M in revenue and above. You do not need a six-figure econometric engagement. You need a spreadsheet that regresses pipeline generated against brand spend, performance spend, and two or three control variables like quarter-end seasonality and macro. Do it monthly for four quarters. The model will be directionally wrong in the first two quarters and directionally useful by the fourth. That is the point. Attribution theater dies when the regression shows brand spend explains more of the pipeline variance than last-click credit ever did.
The 60/40 brand-to-performance mix is not a preference. It is the math that explains why your CAC is inflating while your pipeline is stalling. Binet and Field proved it. Your last-click dashboard hides it. This guide is the operating discipline for running a marketing portfolio that compounds across four-year horizons instead of four-week reports.
How relevant and useful is this article for you?
About the Author(s)
 Emily Ellis is the Founder of FintastIQ. Emily has 20 years of experience leading pricing, value creation, and commercial transformation initiatives for PE portfolio companies and high-growth businesses. She has previous experience as a leader at McKinsey and BCG and is the Founder of FintastIQ and the Growth Operating System.
References
- Donald Miller. Building a StoryBrand. HarperCollins Leadership, 2017
- Al Ramadan, Dave Peterson, Christopher Lochhead & Kevin Maney. Play Bigger. HarperBusiness, 2016
- Sean Ellis & Morgan Brown. Hacking Growth. Crown Business, 2017
- Geoffrey Moore. Crossing the Chasm. HarperBusiness, 2014
- Philip Kotler, Neil Rackham & Suj Krishnaswamy. Ending the War Between Sales and Marketing. Harvard Business Review, 2006