
The 71% Last-Click Lie That's Hiding Your Real Demand Channel
Last-click attribution overweights the final touch because it is easy to measure, not because it is true. The operators who rely on it over-invest in capture and under-invest in creation. The fix is a three-layer demand model that spends against base, captured, and created demand on purpose.
The Operator's Guide to Demand Generation Without Attribution Theater
Show me your top three marketing channels by revenue. Now show me the three channels your customers name when you ask them how they found you. If those lists are different, you are running attribution theater.
Most operators have never lined up the two lists side by side. They run the dashboard that the ad platforms built for them, the one that assigns 71 percent of credit to paid search and retargeting, and they report those numbers to the board. The board nods. The CFO approves the next quarter's budget. The CMO adds another retargeting pixel. Nobody asks why the CAC keeps creeping up even though the dashboard keeps looking good.
The dashboard is not lying. The model is.
TL;DR.
- Last-click attribution overweights the final touch because it is easy to measure, not because it is true. The channels closest to the cash register get the credit. The channels that created the demand get cut.
- The fix is not more dashboards. It is a demand model that separates base demand, captured demand, and created demand and funds each on purpose with its own KPI and its own time horizon.
- The operators who rebuild the model almost always find the same pattern. They are spending too much capturing demand that would have arrived anyway and too little creating demand that would never have arrived at all. Fixing the mix drops blended CAC without dropping revenue.
The core problem
Last-click attribution exists because it is measurable, cheap, and produces a number every Monday morning. It does not exist because it reflects how demand forms. Byron Sharp in How Brands Grow is explicit on this point. Demand is built through mental availability over time, across many light touches, most of which the customer does not remember at the moment of purchase. The click the customer finally made is not the cause of the purchase. It is the final expression of a decision that was already 80 percent complete.
Meet Thistle & Spoke. 95 people. $32M revenue. B2B2C wellness brand selling across three channels. Direct-to-consumer through their site. Wholesale into 400 specialty retailers (yoga studios, Pilates boutiques, independent wellness clinics). Clinical partnerships with 40 naturopathic and functional-medicine practices that recommend the product inside treatment plans.
The last-click dashboard told their CMO, Priya, a clean story. 71 percent of revenue came from paid search and retargeting. Email was 14 percent. Everything else was a rounding error. The quarterly board slide was titled "Performance Marketing Delivers." The CFO approved another $1.2M in paid-search spend for the following year.
Then Priya ran a customer survey with their top 500 accounts and a media-mix model across 36 months of spend. The new numbers were not clean. 58 percent of demand was being created by earned PR coverage and practitioner word-of-mouth. The paid search was capturing that demand at the bottom of the funnel, closing the deal the naturopath had already opened, and taking 71 percent of the credit for doing so. The paid-search spend was not wrong. The allocation was. They were paying a premium to buy customers who were already walking in the door.
Six months after they rebuilt the model and moved 22 percent of paid spend into practitioner partnerships and earned-PR investment, blended CAC dropped 29 percent. Revenue held. The board slide changed. The story the dashboard told finally matched the story the customers told.
That gap between the two stories is the cost of attribution theater. It is a pricing problem disguised as a marketing problem. Confusion is the enemy of willingness to pay, and attribution confusion at the operator level shows up as under-investment in the channels that build brand equity, which shows up as a category where nobody has strong mental availability, which shows up as a paid-search auction where you are bidding against competitors for customers who have no preference. The price of clicks goes up. Nobody connects it back to the model.
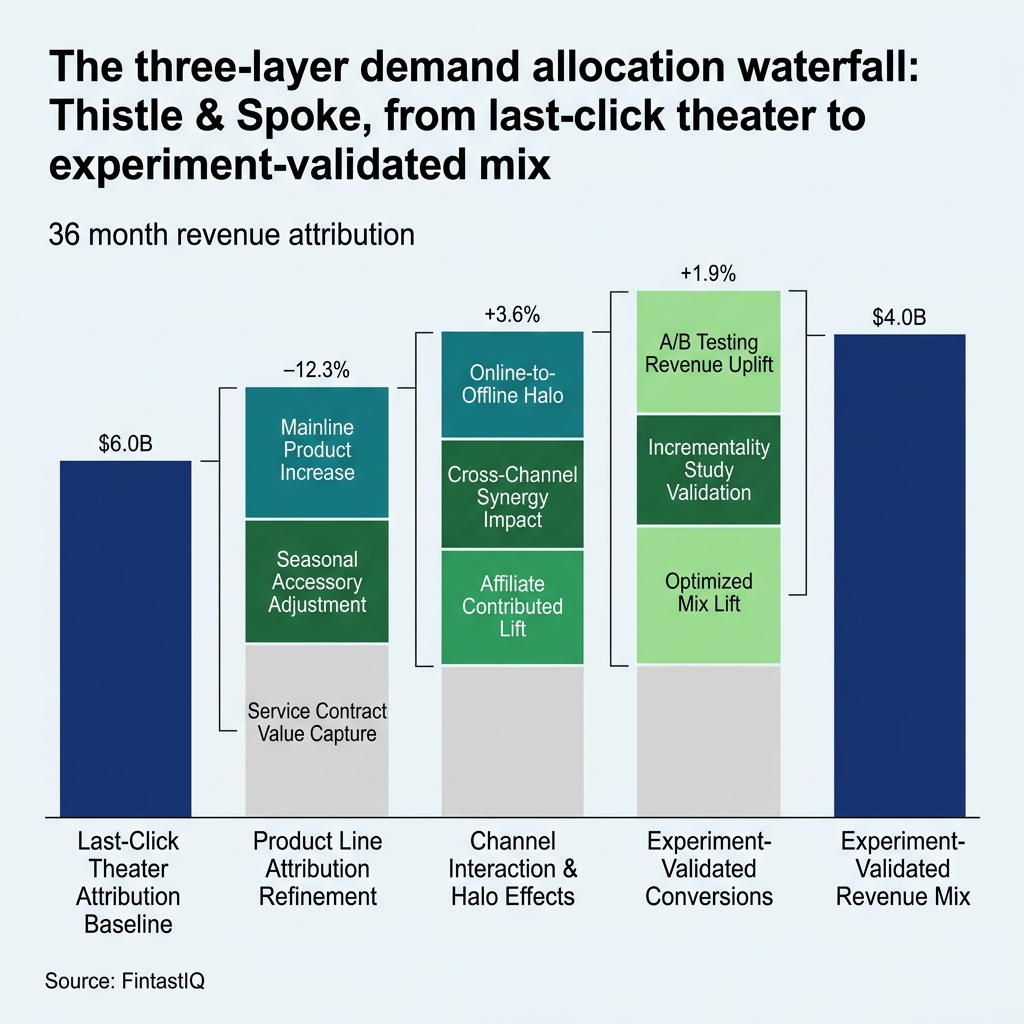 Exhibit: Three-layer demand allocation waterfall
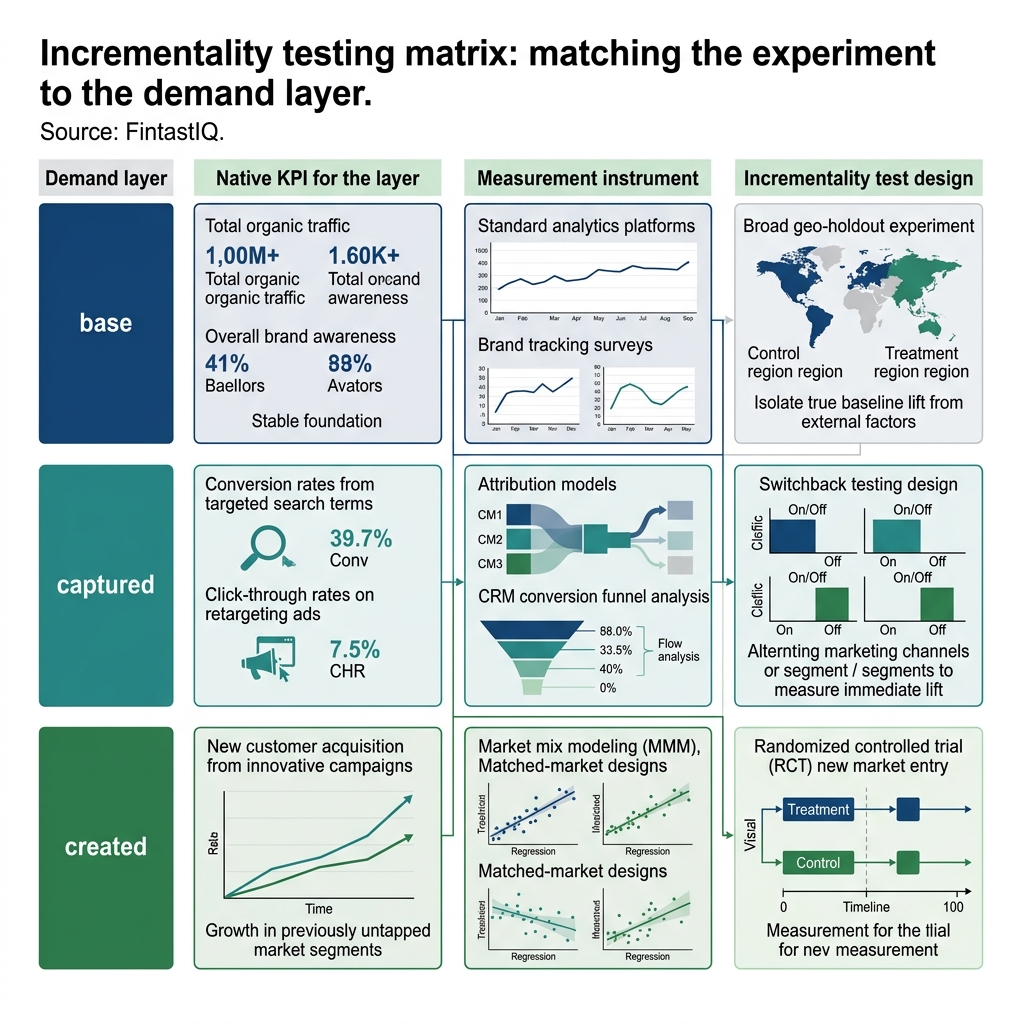 Exhibit: Incrementality testing matrix
The three-layer demand model
Three layers. Different KPIs. Different time horizons. Different budgets. You spend against each on purpose.
Layer one: base demand
Base demand is the category-level demand your brand captures through mental availability. It is the portion of the market that thinks of you unprompted when they think of the category. Byron Sharp's research across dozens of categories is blunt on this. Brands with higher mental availability buy lower-cost customers across every channel they run. Base demand is an asset that compounds or decays depending on whether you invest in brand-building.
The KPI is unaided brand awareness in your target segment. The time horizon is 12 to 24 months. The budget is the one CFOs fight hardest. Binet and Field put the ratio at roughly 60 percent brand-building and 40 percent activation across most categories, with the mix shifting toward brand for categories with longer consideration cycles.
Thistle & Spoke was spending roughly 8 percent of marketing budget on brand-building. Categories like theirs (considered wellness purchase, 3 to 6 month consideration window for clinical buyers, referral-heavy) typically need 40 to 50 percent. The imbalance was not a tactical miss. It was a structural one. The board was funding the harvest and starving the planting.
Layer two: captured demand
Captured demand is intent-stage demand. The customer has already decided to buy something in your category. They are now deciding where. Paid search, retargeting, comparison content, review sites, and direct-response social sit here. This is the layer last-click attribution sees well. It is also the layer that fools operators into thinking they understand the whole system.
The KPI is conversion rate and cost per acquisition on in-market intent. The time horizon is weeks, not quarters. The budget is the one operators already know how to manage. The failure mode is over-spending against it because it is easy to measure, which starves the layers that created the intent in the first place.
For Thistle & Spoke, paid search and retargeting were running at 71 percent of last-click credit but capturing demand that had originated upstream. A holdout test in three geos revealed that reducing paid-search spend by 30 percent in matched markets moved revenue by only 4 percent. The channel was capturing, not creating. It was a discount on future pipeline disguised as a performance channel.
Layer three: created demand
Created demand is net-new awareness. It is the customer who did not know they had the problem, did not know your category existed, or did not know you were the option until your channel put you in front of them. Earned PR. Practitioner referrals. Podcast appearances. Long-form content. Community-building. Sangram Vajre's work on named-account ABM is the B2B version of the same layer. Seth Godin's Permission Marketing and This Is Marketing are the consumer version.
The KPI is new-customer share from channels without a direct-response mechanic, measured through post-purchase surveys and geo-level incrementality tests. The time horizon is 6 to 18 months. The budget is the one most founders cut first when the quarter is soft, because the line on the spreadsheet does not have a last-click receipt.
Thistle & Spoke's practitioner network was the most effective created-demand channel they had. A naturopath recommending a product inside a treatment plan produces a patient who converts at 4x the rate of a paid-search click, returns at 3x the rate, and has an LTV that is roughly 2.5x higher. The dashboard assigned zero credit to the naturopath. The paid search pixel took the credit when the patient completed the order three weeks later.
The cross-layer spending discipline
The model works only if you allocate on purpose. Three rules.
Rule one. Set the ratio before the quarter, not during it. Decide the percentage of budget going to each layer based on category dynamics, brand maturity, and consideration cycle length. Write it down. Review it quarterly. Do not let the monthly dashboard pull spend back toward the layer that looks cheapest.
Rule two. Measure each layer with its native KPI. Base demand is unaided awareness. Captured demand is conversion-rate and CPA. Created demand is incrementality and post-purchase attribution. Do not apply CPA to a brand campaign. Do not apply awareness to a retargeting ad. Cross-contamination of KPIs is how attribution theater creeps back in.
Rule three. Reconcile the layers with media-mix modeling and incrementality tests, not with a single dashboard. The dashboard is for operating inside a layer. The MMM and the incrementality test are for allocating across layers. Different tools for different jobs.
Where this breaks
Three failure modes. Each one costs real money.
Failure one: the board rewards last-click. The CFO asks for revenue attribution by channel. The CMO hands over the last-click report because it is the one the ad platforms auto-generate. The board approves budget against that report. The CMO now has a budget shaped by a model they know is wrong, enforced by a quarterly review cycle they cannot change unilaterally. Fix: do not bring last-click to the board. Bring a one-page demand map with the three layers, the KPI per layer, and the incrementality result that validates the allocation. The first time the board sees this, they push back. The second time, they start asking better questions. The third time, they stop asking for the old report.
Failure two: incrementality testing gets skipped because of the rigor tax. A clean incrementality test requires holding out a geo or an audience for 8 to 12 weeks, accepting a short-term revenue dip of 3 to 6 percent in that geo, and waiting for the read. The CFO hears "short-term revenue dip" and kills the test. The CMO defers to opinion. The allocation freezes. Fix: frame the test as insurance, not a cost. A 4 percent revenue dip in one geo for one quarter is a rounding error. The cost of spending $1.2M against a misallocated budget for twelve months is not. Run one test per quarter. Rotate the channel you test. Build a two-year dataset. After four tests, you have a defensible allocation model. The rigor tax pays for itself on the first reallocation.
Failure three: media-mix modeling without the data hygiene to feed it. An MMM is as good as the data you pour into it. Operators spin up an MMM project, discover their spend data is in six different spreadsheets, their revenue data is missing channel tags for the first eighteen months, their practitioner referrals have no tracking code, and their earned PR mentions were never logged against lift windows. The MMM produces noise. The operator blames the model. Fix: clean the data first. One quarter of data hygiene (standardized spend taxonomy, channel-level revenue tagging, a practitioner referral code system, a PR mention log with date and reach) produces a dataset the MMM can read. Operators who skip this step get the MMM output they deserve.
The 30-60-90 sprint to kill attribution theater
Days 1 to 30. Run the three-lists diagnostic and audit the last 36 months of spend. List the top three channels by last-click revenue. Run a 500-customer survey asking how they first heard about you and what finally got them to buy. Pull a spend-by-channel-by-month table for 36 months. Publish the three lists side by side to the leadership team. Do not argue about which list is right. Name the delta. That delta is the size of your attribution theater.
Days 31 to 60. Build the three-layer demand map and set the allocation. Classify every current spend line into base, captured, or created demand. Calculate current percentages. Set target percentages based on category dynamics and consideration cycle. For most considered-purchase categories, the target is roughly 40 to 50 percent base, 30 to 40 percent captured, 20 to 30 percent created. Publish the current-to-target gap. Pick one channel from the under-invested layer to fund by reallocating spend from the over-invested layer. Do not increase total budget. Move it.
Days 61 to 90. Run one incrementality test and publish the result. Pick one channel. Design a matched-geo or matched-audience holdout. Hold the holdout for 8 to 12 weeks. Measure the revenue delta. Publish the result to the board alongside the reallocation proposal. The first test is the muscle builder. The fourth test is the habit. The eighth test is the operating system. After two years of quarterly tests, your allocation is calibrated against experimental evidence, not opinion, and your CFO stops asking for last-click reports because they have a better instrument.
FAQ
What is attribution theater? Reporting marketing performance against a model you know is wrong because the model is easy to run and the dashboard looks decisive. Last-click is the most common form. It credits the final touch, ignores the upstream demand creation, and produces a board slide that rewards the channels closest to the cash register.
Why not use multi-touch attribution instead? Multi-touch softens the lie without fixing it. It still only measures the touches you can tag. Earned PR, practitioner word-of-mouth, and podcast mentions do not show up in a pixel-based model no matter how many touches you weight. You need MMM plus incrementality for the channels the tags cannot see.
How do I know if I am running attribution theater? Run the three-lists diagnostic. Top three by last-click. Top three by customer survey. Top three by incrementality. If the lists do not match, your attribution model is narrating one story while your business runs on another.
What is the three-layer demand model? Base demand (category-level, brand-driven). Captured demand (intent-stage, performance-driven). Created demand (net-new awareness, earned and owned). Each layer gets its own budget, KPI, and time horizon.
What is incrementality testing and why do I need it? A controlled experiment where you turn off or turn up a channel in a matched geo or audience and measure the revenue delta against a holdout. It is the only way to know if a channel is creating demand or capturing demand that would have arrived anyway.
Does this apply to B2B SaaS? Yes. Vajre's ABM Is B2B applies the same three layers to named accounts. Different units, same model.
How long before blended CAC moves? Three to six months for the reallocation to show. Twelve months for the created-demand layer to compound.
What if my CFO will not approve created-demand spend? Give the CFO the incrementality test, not the attribution model. A controlled holdout with a revenue delta is a clean experiment. It does not require believing any attribution theology.
Run the free assessment or book a consultation to apply this framework to your specific situation.
Questions, answered
8 QuestionsWhat is attribution theater and why does last-click reporting still rule the dashboard?
Attribution theater is the practice of reporting marketing performance against a model you know is wrong because the model is easy to run and the dashboard looks decisive. Last-click attribution is the most common form. It credits the final touch the customer clicked before converting, ignores the six touches that created the intent, and produces a board slide that rewards the channels closest to the cash register. It feels rigorous. It is not.
Why doesn't multi-touch attribution fix the last-click attribution problem?
Multi-touch attribution softens the lie without fixing it. It still only measures the touches you can tag. Earned PR, practitioner word-of-mouth, in-store discovery, and podcast mentions do not show up in a pixel-based model no matter how many touches you weight. You need media-mix modeling plus incrementality testing to see the channels the tags cannot see. Multi-touch is a better-looking version of the same blind spot.
How do you diagnose whether your marketing org is running attribution theater?
Run the three-lists diagnostic. List your top three channels by last-click revenue. List the top three channels your customers name when you ask them how they found you. List the top three channels your CAC changed the most when you paused spend. If those three lists do not match, your attribution model is narrating one story while your business runs on another.
What is the three-layer demand model (base, captured, created)?
Base demand is the category-level demand driven by brand strength and category awareness. Captured demand is intent-stage demand that a customer already has and is deciding where to spend. Created demand is net-new awareness that did not exist before your channel put it there. You spend against each layer with a different budget, a different KPI, and a different time horizon.
What is incrementality testing and how do you run a geo-holdout experiment?
Incrementality testing is a controlled experiment where you turn off or turn up a channel in a matched geo or audience and measure the revenue delta against a holdout. It is the only way to know if a channel is creating demand or capturing demand that would have arrived anyway. Operators skip it because it feels like a rigor tax. The tax is a rounding error compared to the cost of spending against a model that cannot distinguish capture from creation.
Does the three-layer demand model apply to B2B SaaS or only consumer brands?
Yes, with named-account mechanics. Sangram Vajre in ABM Is B2B argues the same three layers apply, just with different units. Category demand becomes industry-level awareness. Captured demand is in-market accounts with buying intent. Created demand is target accounts who did not know they had the problem until your content, event, or partnership named it. The model is the same. The units are different.
How long after reallocating demand spend before blended CAC actually moves?
Three to six months for the reallocation to show, twelve months for the created-demand investment to compound. Binet and Field in The Long and Short of It put the ratio at roughly 60 percent brand and 40 percent activation for most categories. The operators who shift spend and expect a two-week CAC drop miss the point. You are buying a demand curve, not a click.
How do you get a CFO to approve spend on a channel that can't be directly attributed?
Give the CFO the incrementality test, not the attribution model. A controlled geo holdout with a revenue delta is a clean experiment. It does not require believing any attribution theology. If the holdout shows the created-demand channel is driving incremental revenue, you have a CFO-grade case. The conversation changes from 'trust the MMM' to 'here is the experiment that replicates the lift.'
Last-click attribution overweights the final touch because it is easy to measure, not because it is true. The operators who rely on it over-invest in capture and under-invest in creation. The fix is a three-layer demand model that spends against base, captured, and created demand on purpose.
How relevant and useful is this article for you?
About the Author(s)
 Emily Ellis is the Founder of FintastIQ. Emily has 20 years of experience leading pricing, value creation, and commercial transformation initiatives for PE portfolio companies and high-growth businesses. She has previous experience as a leader at McKinsey and BCG and is the Founder of FintastIQ and the Growth Operating System.
References
- Sean Ellis & Morgan Brown. Hacking Growth. Crown Business, 2017
- Gabriel Weinberg & Justin Mares. Traction. S-curves Publishing, 2014
- Donald Miller. Building a StoryBrand. HarperCollins Leadership, 2017
- Philip Kotler, Neil Rackham & Suj Krishnaswamy. Ending the War Between Sales and Marketing. Harvard Business Review, 2006
- OpenView Partners. SaaS Benchmarks Report. OpenView Partners, 2023