
38 Farms Churned Before Anyone Ran a Supply-Side Interview
In a marketplace the JTBD is always two jobs, never one. Build the product for the supply side and you strand demand. Build for demand and you starve supply. This guide is the dual-JTBD intake and liquidity ledger that makes the trade-off visible instead of hidden.
The Operator's Guide to Jobs-to-be-Done for Marketplace Products
Your marketplace retention dashboard has one line. You have two customers. You are measuring the wrong thing.
Pull up your last quarterly product review. Count the slides about demand-side experience. Count the slides about supply-side experience. In most decks the ratio is four to one. Your roadmap mirrors the ratio. So does your churn.
Platform Revolution framed the dynamic fifteen years ago. A marketplace is not a product with two audiences. It is two products stitched together by liquidity. Parker, Van Alstyne, and Choudary were explicit. When one side degrades, the other side leaves. Not next quarter. Usually this quarter, once the substitution options mature.
Your team shipped for the loud side. The quiet side is leaving.
TL;DR.
- A marketplace JTBD is always two jobs, never one. The supply-side job is "find reliable, profitable buyers with low effort per transaction." The demand-side job is "find dependable, differentiated suppliers with low search cost." These jobs sit in structural tension. One product cannot optimize both without an explicit ledger of trade-offs.
- Most marketplace teams ship for demand because demand pays the take rate. The result is supply-side retention decay, hidden for six to eighteen months, then visible as a liquidity cliff that cannot be fixed with marketing spend.
- This paper is the dual-JTBD intake and liquidity ledger. It makes the trade-off visible inside the product process. The AI-assisted liquidity matching appendix covers where agents fit in the discovery loop.
The core problem
Single-JTBD thinking is the default because it is easier. One job, one persona, one interview guide, one feature prioritization. Teams trained on Christensen and Torres carry the habit from single-sided products into marketplaces. The habit breaks on contact with the network. Christensen built the framework in Competing Against Luck for products with one hirer. Marketplace hirers come in pairs.
Meet Greenhouse Supply Co-op. 40 people, $90M GMV, a two-sided marketplace connecting specialty food distributors to regional farms. 380 supply-side farms, heterogeneous by design. Small family farms. Mid-size co-ops. Organic-certified single-operators. 1,400 demand-side distributors including restaurants, specialty grocers, and meal-kit operators.
Last year the product team shipped a beautiful sourcing UX for distributors. Filter by organic certification, seasonal availability, radius, reputation score, minimum order quantity, lead time, past order history. The distributor NPS moved from 41 to 68 in two quarters. The CRO called it the best quarter in company history.
The supply-side retention curve told a different story. In the same two quarters, 38 farms churned. That was 10 percent of supply gone, disproportionately from the small family farms segment. Reason code: the farmer app still required 14 manual entries per shipment. The product team had not shipped supply-side workflow improvements in 11 months. The beautiful demand UX was built on top of a farmer app that had not meaningfully changed since the Series A.
That is the pattern. Demand-side wins are visible and celebrated. Supply-side losses are quiet, delayed, and measured on a dashboard nobody pulls. By the time the liquidity cliff shows up in GMV, the supply damage is six months old.
This is not a product quality problem. It is a JTBD coverage problem. The team ran discovery on one side. The other side left.
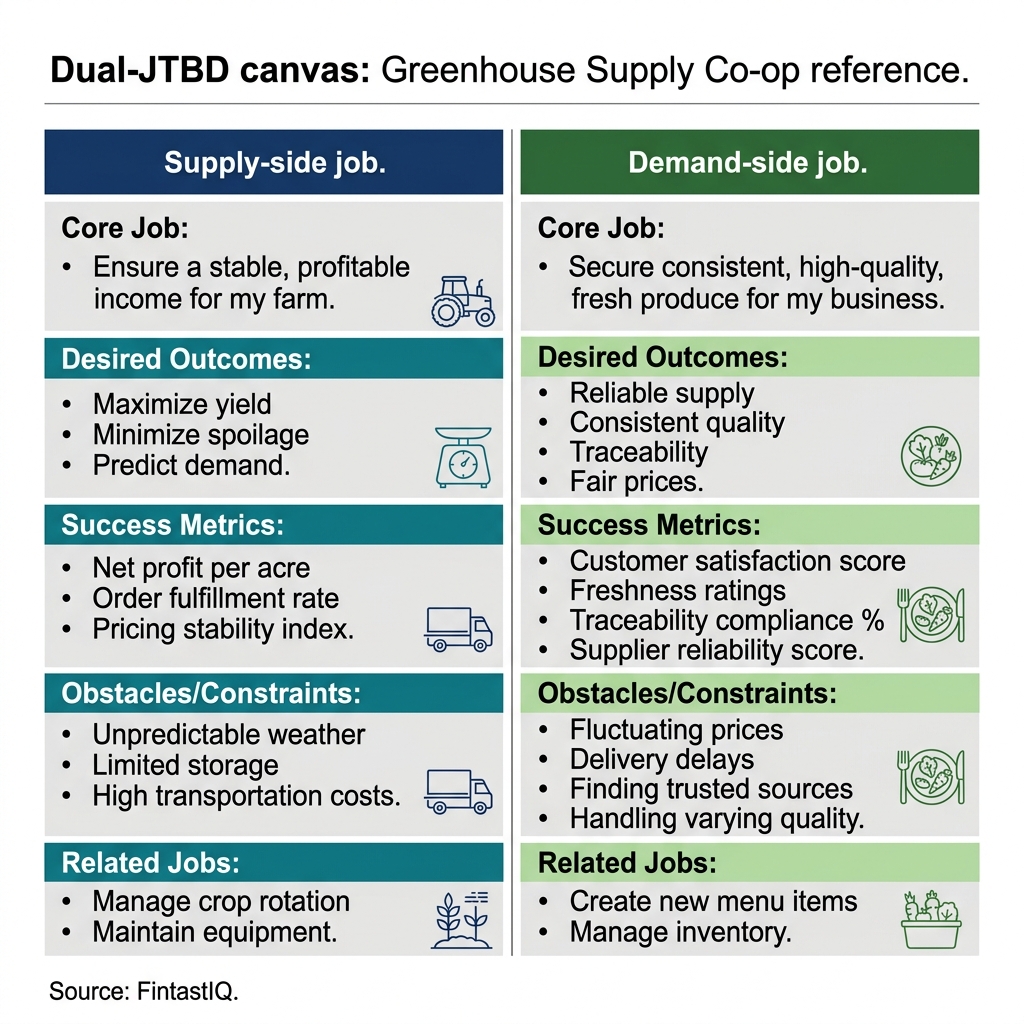 Exhibit: Dual-JTBD canvas
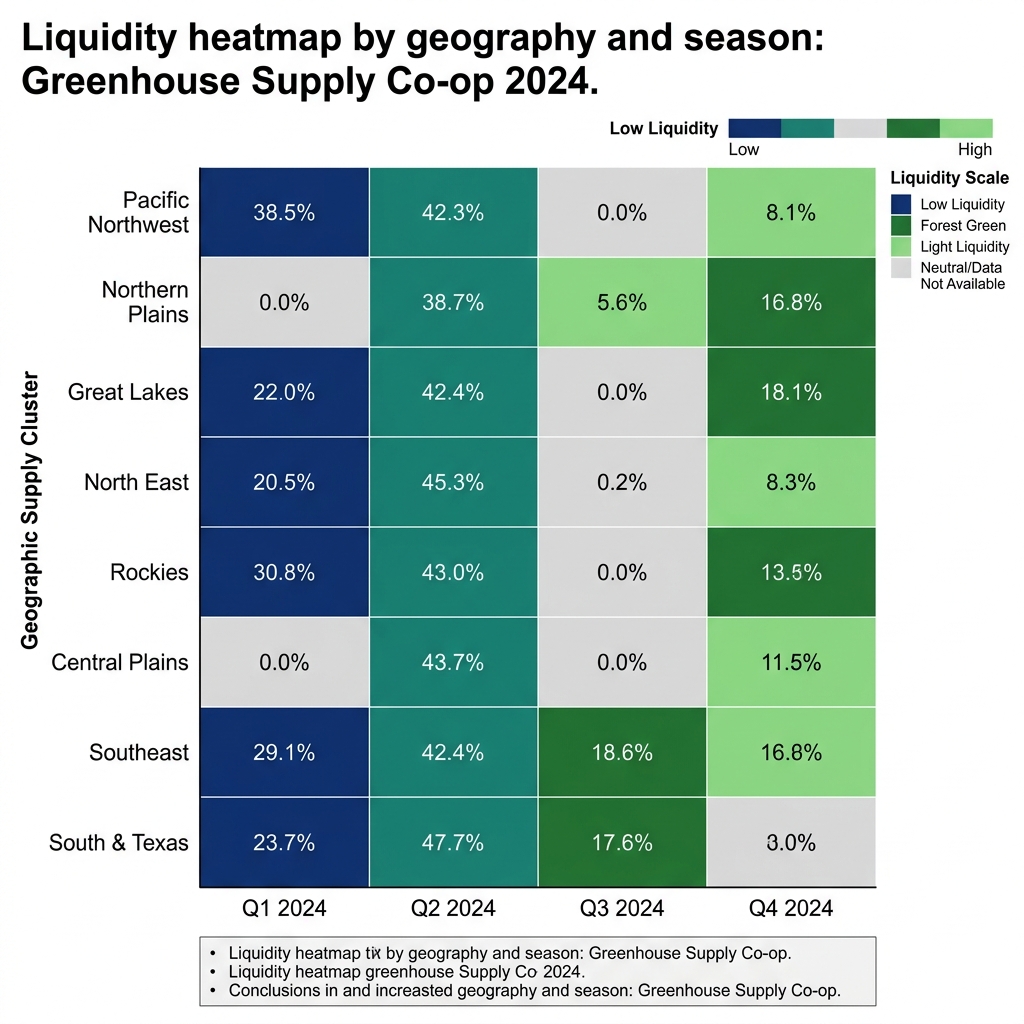 Exhibit: Liquidity heatmap
The dual-JTBD framework
Four pieces. Every marketplace product decision answers all four before engineering is approved.
Piece 1: The supply-side job and the supply-side alternative
Before a spec enters the backlog, name two things on the supply side. The job the feature is hired for by the farm, the driver, the host, the seller. The alternative the supply-side participant is currently using or could switch to.
Moesta is the anchor here. Demand-Side Sales 101 reframes the buyer as someone leaving a prior solution behind. The frame works identically for the supply side of a marketplace. The farm is leaving something to be on your platform. It might be a regional distributor contract. A co-op membership. A farmer's market booth. A phone-based order book. Whatever it is, that is your benchmark. Your supply-side feature is priced against that alternative.
At Greenhouse, the farm's real alternative was a regional broker who took a 22 percent margin but handled all logistics. Greenhouse took 12 percent but dumped 14 manual entries per shipment back on the farm. The farm did the math. Ten percent in lower take rate divided by two hours of data entry per shipment equaled roughly $18 per hour of farm-owner time. For the small family farm doing seven shipments a week, it was a losing trade. Greenhouse did not know this because no one had done supply-side discovery in eleven months.
If you cannot name the supply-side job and the supply-side alternative in one sentence each, the spec has no supply thesis. Send it back.
Piece 2: The demand-side job and the demand-side alternative
The second pair, run identically. What is the distributor hiring your marketplace to do. What is the distributor leaving behind.
Christensen's frame applies cleanly here. The job is functional (source fifteen SKUs of specialty produce for a restaurant menu refresh), emotional (signal to the chef that the buyer did the work), and social (maintain the restaurant's provenance story). The alternative is a Rolodex of regional brokers, direct farm relationships, or a generic food-service distributor.
At Greenhouse, the distributor's alternative was a combination of three brokers plus direct calls to four anchor farms. The marketplace replaced the brokers. It did not replace the direct farm calls, because the distributor felt those relationships produced better quality. That insight should have routed to a supply-side feature (tools that made farms feel relationship-rich even at scale). It did not, because the ledger did not exist. The insight lived in one distributor interview transcript and never crossed the aisle.
Dunford in Obviously Awesome makes the point sharply. You position each side of a marketplace separately because each side is leaving a different alternative behind. Supply is not leaving what demand is leaving. Pretending otherwise produces marketing and product that lands half-right for both sides.
Piece 3: The liquidity bridge
This is the piece most marketplaces never make explicit. Which side gets the better UX this sprint, and why.
Evans framed the chicken-and-egg problem in Matchmakers. Liquidity is the asset. One side is always closer to walking than the other. Your job as a product team is to know which side is closer to walking, measure it, and invest proportionally.
The liquidity bridge is a three-column ledger. Sprint or initiative. Side favored. Reason. Every entry has a date and an owner. No entry is neutral. A seemingly balanced feature (a search filter both sides use) gets decomposed into the parts that help each side and ledgered accordingly.
Over twelve months Greenhouse's retroactive ledger looked like this. 34 entries total. 29 demand-favored. 3 supply-favored. 2 genuinely neutral. No one had run that tally before. When the head of product ran it, the reaction in the room was silence. The cliff was no longer surprising. The ledger was the answer.
The bridge is not about perfect balance. A 70-30 demand-favored ratio might be correct in a given quarter if supply liquidity is abundant and demand liquidity is the constraint. The bridge is about knowing the ratio. When your team cannot tell you the ratio without two weeks of research, you are flying blind on the most important variable in the business.
Piece 4: The take-rate and packaging trade-off lens
The last piece is the pricing expression of the first three.
Most marketplaces treat take rate as a single number. 12 percent. 15 percent. 22 percent. One lever. Every trade-off becomes a fight over basis points. That is a packaging failure disguised as a pricing failure.
Packaging beats pricing, even in marketplaces. You package each side of the network separately. Supply-side tiers (verified, certified, featured) create differentiated value that justifies differentiated take rates and differentiated visibility. Demand-side tiers (self-serve, managed, enterprise) create differentiated access to supply that justifies different fees and different service levels. Confusion is the enemy of willingness to pay, and a flat take rate across a heterogeneous supply base and a heterogeneous demand base is the loudest form of confusion you can ship.
At Greenhouse the flat 12 percent take rate did two things wrong at once. It undercharged the self-serve distributors who extracted the most value from the sourcing UX, and it overcharged the small family farms whose alternative was a 22 percent broker with full logistics. The number was wrong on both sides because the architecture was wrong. The fix was not a different number. It was a different shape.
A two-tier supply structure (standard at 10 percent with basic logistics, premium at 14 percent with logistics handling and featured placement) moved small-family-farm retention from 62 percent to 89 percent inside two quarters. A two-tier demand structure (self-serve at a 3 percent buyer fee with rate card, managed at a 7 percent buyer fee with dedicated sourcing support) moved demand-side ARPU by 24 percent. Same GMV base. Different architecture.
Nagle and Müller in The Strategy and Tactics of Pricing call this segment-aware price architecture. Rumelt in Good Strategy Bad Strategy calls it coherent action. Whatever you call it, it is how willingness-to-pay research fails in new categories and packaging salvages the miss. The benchmark does not exist, so you build the architecture that makes the benchmark.
Where this framework breaks
Three failure modes. Each one has a name and a price tag.
Failure one: the winner-take-all side fallacy. A team decides one side of the marketplace is the decisive side and optimizes exclusively for it. The logic sounds reasonable. In some markets one side is structurally dominant. In practice, the team often picks the wrong side (usually demand, because demand is loud). Twelve months later supply is exhausted, quality degrades, and demand leaves for a competitor that treated supply better. Fix: run the liquidity ledger for one quarter before you commit to a single-side strategy. If the ledger shows neither side is walking, you have a coverage problem, not a concentration strategy. The best operators compete on discipline, not instinct, and instinct almost always picks demand.
Failure two: vanity GMV. The headline number looks healthy. GMV is up 28 percent year over year. Underneath, the top 10 percent of demand accounts drive 70 percent of GMV, and the top 5 percent of supply serves them. The marketplace has a thin liquidity layer on a narrow revenue base. One large distributor churns and 14 farms lose their biggest buyer overnight. Fix: every GMV report shows supply concentration and demand concentration alongside the topline. If either side has a Herfindahl-Hirschman above 0.25, the number is not what it looks like. Greenhouse was at 0.31 on demand concentration and did not know it until the board asked.
Failure three: over-curated supply. The product team, having discovered supply-side pain in discovery, overcorrects. Supply gets a beautiful onboarding flow, a tiered rating system, and manual curation on every listing. Supply feels premium. Demand cannot find anyone. The curation bar is so high that 60 percent of farms who apply never get listed. Demand tries three times and leaves because the marketplace is empty relative to alternatives. Fix: run supply quality as a gradient, not a gate. Let most supply list with a tier indicator. Let demand filter. Heterogeneous supply is the marketplace's strength, not a defect to cure.
The 30-60-90 sprint for dual-JTBD marketplace product
Days 1 to 30. Audit your last 10 product decisions and write the ledger retroactively. For each decision, name four things. The supply-side job. The demand-side job. Which side the decision favored. The measurable liquidity impact on each side. Expect a 70-30 or worse imbalance toward demand. That imbalance is your baseline. Publish the ledger to the product leadership team and the marketplace ops team. Do not defend the imbalance. Name it. The retroactive ledger is the artifact that earns the right to change the intake process.
Days 31 to 60. Introduce a dual-JTBD intake gate on new specs. Every new spec names the supply job, the supply alternative, the demand job, the demand alternative, and the predicted liquidity ledger entry. Signed by the PM, a supply-side discovery lead, a demand-side discovery lead, and a marketplace ops rep. One real interview per side per spec. Torres in Continuous Discovery Habits is explicit. Weekly customer touchpoints feed the discovery loop, and in marketplaces that means one interview per side per week at minimum. The gate is a document, not a committee. If the four pieces cannot fit on one page, the spec is not ready.
Days 61 to 90. Ship one feature through the gate end to end. Pick one feature that scores positively on both JTBDs. Measure the actual liquidity ledger entry against the predicted entry. Publish the delta. If the delta is under 25 percent, the gate is calibrated. If the delta is over 25 percent, the gate needs tightening on the supply-side quantification step, because supply estimates are the ones teams get wrong. The first feature builds the muscle. The tenth builds the habit. The hundredth builds the operating system.
FAQ
Why do marketplace product teams default to designing for one side? Because one side writes the check. Demand pays the take rate, so product ships for demand. Supply gets a thinner app and a decaying retention curve nobody watches. The fix is structural, not motivational. Force both JTBDs into the intake artifact before engineering is approved.
What is a liquidity ledger and why does it matter? A running record of every product decision, annotated with which side gained and which side lost. It makes the trade-off visible and stops the team from pretending features are neutral. Without a ledger, debt compounds on whichever side has quieter users. Supply is almost always the quiet side.
How is this different from standard JTBD work? Standard JTBD has one customer. Marketplace JTBD has two customers with opposing success definitions. Designing for one job makes the other job harder. You need both jobs in the same artifact, both alternatives priced, and a ledger for every trade-off.
Is the take rate the right trade-off lever? It is one lever. Packaging is a bigger one. Most marketplaces treat take rate as the only knob, turning every JTBD conflict into a basis-point fight. Differentiated tiers on each side solve conflicts a flat take rate cannot.
What if we cannot run discovery on both sides? Run it anyway. One supply interview and one demand interview per week at minimum. The cost of skipping supply-side discovery shows up eventually as the retention cliff. It is cheaper to pay the interview cost than the churn cost.
How do we avoid vanity GMV? Track supply concentration and demand concentration alongside the topline. If either is above 0.25 on the Herfindahl-Hirschman index, the GMV story is incomplete and probably misleading.
When should we deliberately favor one side? When liquidity forces it. Early-stage marketplaces subsidize the harder-to-acquire side until liquidity holds. That decision is dated, budgeted, and written in the ledger with an exit condition. Permanent subsidy dressed up as strategy is the failure mode.
What is the fastest way to start? The 30-60-90 above. Retroactive ledger, intake gate, instrumented ship. The muscle is 90 days. The habit is a year.
Ready to stop strand-building one side of your marketplace?
Run the free assessment or book a consultation to apply this framework to your specific situation.
Questions, answered
8 QuestionsWhy do marketplace product teams keep building for one side of the network?
Because one side usually writes the check. Demand pays the take rate, so product ships for demand. Supply gets a simpler app, a thinner onboarding, and a retention curve that decays in silence. The fix is structural. Your intake artifact forces both JTBDs to be named before engineering is approved. If you cannot articulate the supply job and the demand job in one sentence each, the spec is not ready.
What is a marketplace liquidity ledger and why does every product team need one?
A liquidity ledger is a running record of every product decision, annotated with which side gained and which side lost. It makes the trade-off visible. Your team stops pretending that features are neutral. Every sprint either thickened supply, thickened demand, or thinned one to feed the other. Without a ledger, the marketplace compounds debt on whichever side has quieter users. Supply is almost always the quiet side.
How is dual-sided marketplace JTBD different from standard Jobs-to-be-Done work?
Standard JTBD identifies one job, one alternative, one hire. Marketplace JTBD has two customers with opposing success definitions. A distributor wants more supply, faster. A farm wants fewer, better-paying distributors and simpler logistics. Designing for one job makes the other job harder. You need both jobs in the same artifact, priced against each side's alternative, and a ledger entry for every trade-off the product team made.
Is the marketplace take rate the right lever for trading off supply and demand?
Take rate is one lever. Packaging is another. Reputation signals are a third. Most marketplaces treat take rate as the only knob, which makes every JTBD conflict look like a pricing fight. It is not. Packaging beats pricing, even in marketplaces. Differentiated tiers for each side of the network (supply-side quality tiers, demand-side access tiers) solve conflicts that a flat take rate cannot.
What if we can't run continuous discovery on both sides of the marketplace?
Run it on both sides anyway. Weekly touchpoints per Torres, one supply interview and one demand interview minimum. The cost of not running discovery on the supply side shows up as the retention cliff. Greenhouse Supply Co-op learned that at a cost of 38 farms churned before the product team did a single supply-side discovery interview. Put it in the cadence or the ledger will tell you later, at a worse exchange rate.
How do you avoid vanity GMV when the top 10% of demand drives 70% of volume?
Audit where the GMV is coming from. If the top 10 percent of demand accounts are driving 70 percent of GMV and the supply side serving them is the bottom 40 percent of farms by rating, the number on the dashboard is a story about supply substitution risk, not marketplace health. Vanity GMV is GMV that depends on a thin slice of supply. Track supply concentration alongside GMV or the number lies to you.
When should a marketplace deliberately subsidize one side of the network?
When the chicken-and-egg problem forces it. Evans in Matchmakers is clear. Early-stage marketplaces subsidize the harder-to-acquire side until liquidity holds. That is a known, dated, and budgeted decision. It lives as a line in the ledger with an exit condition. The failure mode is permanent subsidy dressed up as strategy. Name the date the subsidy ends and the metric that ends it.
What is the fastest 30-60-90 way to start dual-JTBD discipline in a marketplace?
A 30-60-90 sprint. Days 1 to 30 audit the last 10 product decisions for dual-JTBD coverage and write the ledger retroactively. Days 31 to 60 introduce the dual-JTBD intake gate on new specs. Days 61 to 90 ship one feature with both jobs named, both alternatives priced, and a measurable liquidity entry on the ledger. The muscle builds in 90 days. The habit takes a year.
In a marketplace the JTBD is always two jobs, never one. Build the product for the supply side and you strand demand. Build for demand and you starve supply. This guide is the dual-JTBD intake and liquidity ledger that makes the trade-off visible instead of hidden.
How relevant and useful is this article for you?
About the Author(s)
 Emily Ellis is the Founder of FintastIQ. Emily has 20 years of experience leading pricing, value creation, and commercial transformation initiatives for PE portfolio companies and high-growth businesses. She has previous experience as a leader at McKinsey and BCG and is the Founder of FintastIQ and the Growth Operating System.
References
- Clayton M. Christensen, Taddy Hall, Karen Dillon & David Duncan. Competing Against Luck. HarperBusiness, 2016
- Anthony Ulwick. Jobs to Be Done. Idea Bite Press, 2016
- Marty Cagan. Inspired. Wiley, 2018
- Teresa Torres. Continuous Discovery Habits. Product Talk, 2021
- Clayton M. Christensen, Scott Cook & Taddy Hall. Marketing Malpractice: The Cause and the Cure. Harvard Business Review, 2005